General Introduction
Phytoplankton species composition in relation to trophic state of the habitat
Phytoplankton growth strategies
Cell size
The function of an extracellular mucous envelope
Desmids
Cultures
Outline of this thesis
Phytoplankton species composition in relation to trophic state of the habitat
The trophic state (or eutrophication level) of a water body determines the potential development of primary producers, consumers and decomposers. The trophic state of a lake is based on the total phosphorus (P) and nitrogen (N) concentrations found in this lake (OECD 1982). Besides on total phytoplankton biomass production, eutrophication level is also of influence on phytoplankton species composition. With respect to freshwaters, in the forties, so-called phytoplankton quotients were developed (Thunmark 1945, Nygaard 1949). Those quotients were used to indicate the trophic state of a water body by comparing the numbers of species in certain algal groups. In all those quotients the green algal family Desmidiaceae (desmids) is placed in the denominator, which means that the group is considered indicative of oligotrophic conditions. Although the concept of plankton quotients was severely critizised, the opinion still holds that desmids are generally encountered in nutrient-poor water bodies (Hutchinson 1967, Reynolds 1984). However, Coesel (1975, 1983) pointed out that not all desmid species follow that trend in distribution, so that the indicative significance can better be considered at the species level.
It can be assumed that the species composition in a given lake to a large extent is determined by competition (Sommer 1989). Competition can occur for several resources, but competition for nutrients is often found to be of major importance to phytoplankton species composition. In that case, growth kinetic characteristics of a species may reflect the specific adjustment to the nutrient supply of a lake during the growth season (Schindler 1977, Kilham & Tilman 1979). Hecky & Kilham (1974) compared two clones of Thalassiosira pseudonana, isolated from two trophically different lakes. The clone from an oligotrophic environment had a higher affinity for nitrate than the clone isolated from the eutrophic site. According to Kilham & Titman (1976) and Tilman (1977) over 70% of the variance in distribution and relative abundance of two species of diatoms along a transect in Lake Michigan could be explained on the basis of species-specific phosphorus and silicium metabolism.
Phytoplankton growth strategies
A well-known classification of growth strategies is that referring to r and K selection, based on the logistic equation of growth (McArthur & Wilson 1967). In phytoplankton terms, r-selected organisms are opportunistic species, with relatively high maximum growth rate (Ámax), small cells and high edibility. K-selected organisms, on the other hand, have a relatively low Ámax, bigger cells and low edibility (Sommer 1981, Turpin 1988). Phytoplankton succession can be interpreted in terms of r- and K-strategies: r-strategists dominate in the early phase of succession when nutrients are in excess. During the summer period, K-strategists take over in succession as a result of nutrient- or light-limited conditions (Istvanovics et al. 1994). With regard to growth under P-limited conditions, Sommer (1985) defined three competitive strategies of phytoplankton species: 1) affinity strategyù species that are efficient users of low concentrations. They are characterized by a steep initial slope of their Monod and Dugdale curves (Ámax/affinity constant for growth, Ks, and maximum uptake rate, Vmax/affinity constant for uptake, Km are high). 2) Velocity strategyù species that utilize temporary nutrient enrichment for rapid growth that compensates for decline under nutrient-impoverished conditions. Those species have both a high Vmax and Ámax. 3) Storage strategyù species that utilize temporary nutrient enrichment for building up an intracellular storage pool. They are characterized by a relatively high Vmax and a relatively low Ámax.
A relation has been established between algal cell size on one hand and Km (Eppley et al. 1969), Ámax (Sommer 1981, 1983) and Vmax (Smith & Kalff 1982) on the other hand. Also a clear positive correlation has been found between cell volume and storage capacity (Stolte & Riegman 1996). Smaller algal cells are generally better competitors for low nutrient concentrations because of a higher affinity for uptake. Therefore cell size is sometimes used as an explanation of distribution patterns (Semina 1972), concluding that small-sized species become dominant in oligotrophic lakes and large-sized species in eutrophic lakes. In general this might be true although experimental data are contradictory. In a mixed phytoplankton sample cultured under stringent P-limited conditions, average cell size appeared to be smaller than in the same sample cultured under pulsed P-limited conditions (Suttle et al. 1987). However, when a mixed phytoplankton sample was cultured under nutrient-limited conditions, it did not result in a selection of the smallest-sized species (Sommer, 1989). However, cell size cannot be considered the decisive factor to uptake and growth kinetics. As, with respect to nutrient uptake, the ratio surface area: cell volume is much more relevant than the volume proper, one should also consider cell shape (Grover 1989c) and the presence of extracellular structures like microfibrils and mucous (Cembella et al. 1984, 1985, Hoagland 1993).
The function of an extracellular mucous envelope
It is known that a mucilage envelope affects buoyancy of algal cells (Boney 1981, Walsby & Reynolds 1980) and protects them against predation (Porter 1973, Decho 1990), but several other functions have been suggested (Hoagland 1993). One of these is that this envelope helps to capture scarce nutrients (Coesel 1994). Also storage of essential nutrients is often suggested as a possible function of a mucous envelope (Lange 1976, Decho 1990). Rorem (1955) showed that the presence of extracellular polysaccharide induced a much larger accumulation of P by inhabiting bacteria than cells without and that much of the increased P content was associated with the polysaccharide slime. Whitton (1967) found evidence that mucilaginous colonies of Nostoc verrucosum can accumulate more Pi from the environment than a comparable biomass of bare cells. Besides being involved in sorption and storage of nutrients, a mucilage sheath could be a suitable (micro-) environment for the activity of extracellular enzymes (Ton & Gander 1979). This topic is treated in the present thesis. As Livingstone et al. (1983) detected phosphatase activity in the sheath of a cyanobacterium species, we studied alkaline phosphatase activity (APA) in relation to presence and absence of an extracellular mucilage envelope in planktonic desmid species.
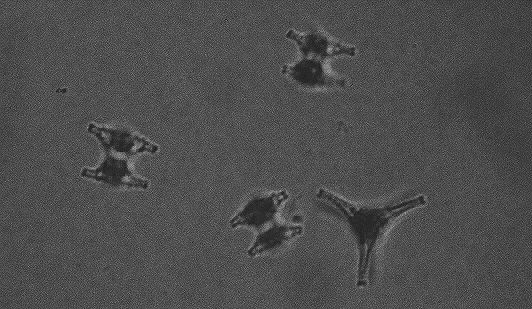
Although most desmid species are found in slightly acid, oligo- mesotrophic environments, it is known that some species particularly flourish in alkaline, eutrophic lakes (Coesel 1983). An intriguing question is, which ecophysiological mechanisms underly this difference in distribution. In this thesis, three desmid species are considered that are roughly comparable in cell size and volume: surface area ratio, and all three occur in the plankton of alkaline water bodies. However, Staurastrum chaetoceras (Schr.) G.M. Smith (Figure 1-1) is characteristic of eutrophic lakes, Staurastrum pingue Teil. (Figure 1-2) is mainly found in eutrophic lakes, but can also be encountered in mesotrophic environments and Cosmarium abbreviatum Rac. var. planctonicum W. & G.S. West (Figure 1-3) only occurs in oligo-mesotrophic lakes. The three species reach maximum population densities at the end of the summer period (Coesel & Kooyman 1994).
Figure 1-1. Cells of Staurastrum chaetoceras in a suspension with Indian ink to show that the cells are not embedded in any mucilage.
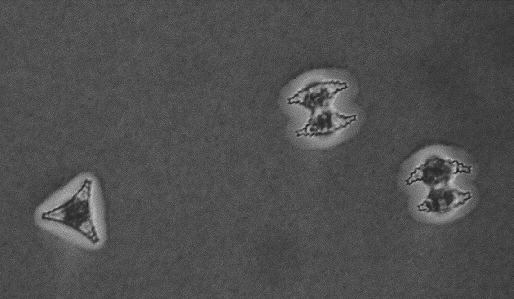
Figure 1-2. Cells of Staurastrum pingue. Indian ink indicating a thin mucous layer roughly following the cell shape.
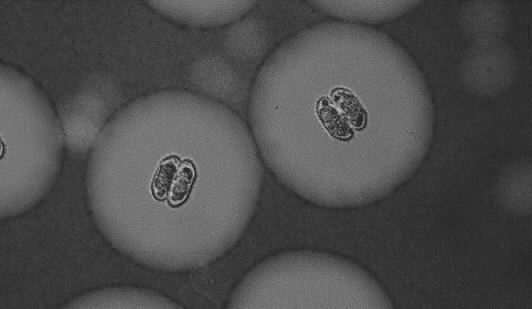
Figure 1-3. Cells of Cosmarium abbreviatum var. planctonicum. Indian ink highlighting a distinct extracellular mucous envelope.
Most experiments were performed in continuous culture (Figure 1-4). This culture method was chosen because steady state conditions can be obtained, with physiologically adapted algal cells. The set-up consisted of a 1 litre culture vessel (modified Kluyver-flask). The speed of inflow of the culture medium was adjusted by a peristaltic pump. The volume of the vessel was kept constant by means of an overflow mechanism. The culture was continuously aerated with sterilized air to achieve homogenous mixing and to avoid carbon limitation. At a low P concentration of the inflow medium and a fixed pump speed, the algae in the culture vessel will grow at a fixed rate under P-limited conditions. When algal biomass stays constant over a certain period, theoretically replacing all algal cells by new ones (about 5 renewals of the culture vessel volume), the algae are considered to be physiologically adapted to the growth condition and the culture is said to be in steady state.
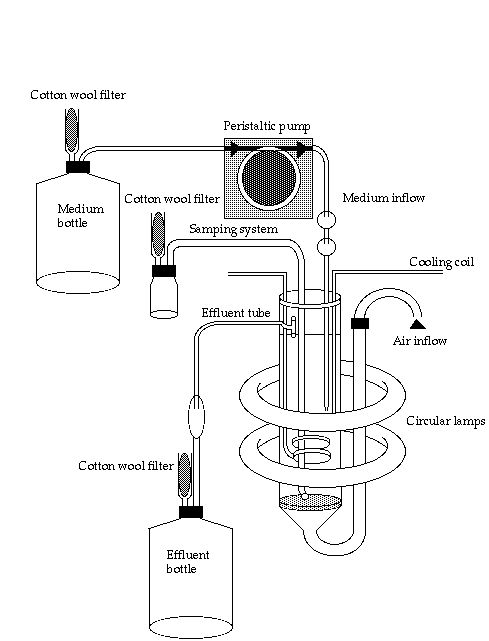
Figure 1-4. Continuous-flow device used in the experiments.
Some additional experiments were performed in batch culture, for example when pulsing algal cells with high P doses that would disturb steady-state conditions in P-limited continuous cultures. Unfortunately, batch cultures can only be used for short periods, because it is hardly possible to keep experimental conditions constant.
All symbols used throughout this thesis are summerized in Table 1-I. More detailed information about these parameters is supplied in the following chapters.
The objective of this thesis was to find out if the distribution pattern of planktonic desmid species, occurring in lakes of different trophic state, can be explained by ecophysiological characteristics of growth and uptake of inorganic phosphorus (Pi) under P-limiting conditions. P was chosen because, in freshwater, it is often growth limiting during summer algal blooms (Kalff & Knoechel 1978).
The uptake and growth kinetics under continuously Pi-limited and Pi-saturated conditions in S. pingue and C. abbreviatum are presented in chapter 2. In this chapter the species are also compared in their cellular phosphorus quota (Qp), cell volume, carbohydrate: protein ratio and yield under Pi limitation. An extended set of Pi uptake and growth kinetic features of S. pingue and S. chaetoceras is presented in chapter 3. To test whether the characteristics found for the 3 desmid species are predictive for competition under P-limited conditions, competition experiments between S. pingue and C. abbreviatum and between S. chaetoceras and C. abbreviatum were executed under both continuous Pi limitation and pulsed Pi addition (chapter 3 and 5).
In chapter 4, C. abbreviatum and S. chaetoceras are characterized in their storage capacity: an important feature when a saturating pulse of P is available. Both Qp of cells growing at Ámax (Qmax) and Qp when internal stores are completely filled (Q'max) are presented. Another feature dealt with in chapter 4 is the time delay before growth resumes after a saturating pulse. P uptake and growth kinetics under pulsed Pi-limited conditions is dealt with in more detail in chapter 5. S. chaetoceras and C. abbreviatum were cultured under two different pulse regimes, and before and after the pulse, uptake kinetics were measured. Differences in kinetics, compared to growth under continuously Pi-limitation, are discussed. All competition experiments between C. abbreviatum and S. chaetoceras under different Pi-limited conditions are summarized and presented in one figure. This chapter also presents data of changes in cell volume in both species, and in the size of the mucous sheath in C. abbreviatum in relation to different culture conditions.
As dissolved Pi is not the only P source available for phytoplankton growth, the use of organic P compounds (Po) is considered in chapter 6. First, C. abbreviatum and S. chaetoceras are characterized in their cellular alkaline phosphatase activity when grown under continuously and pulsed Pi-limited conditions. To check whether the differences found in these characteristics lead to a competitive advantage to one species over the other, competition experiments were performed, using an organic phosphorus compound. In this chapter the possible function of P uptake (sorption, storage) by an extracellular mucous envelope, as present in C. abbreviatum, is also dealt with.
In chapter 7 some earlier findings on growth under different temperatures and under light-limited conditions are considered (Coesel & Wardenaar 1990, 1994). As light is another important resource for phytoplankton growth an onset to a combined consideration of light- and phosphorus-limited growth in C. abbreviatum and S. chaetoceras is presented. As a guideline the model of Huisman & Weissing (1995) was used.
In chapter 8, finally, all ecophysiological species-specific differences found are summarized and considered for their possible adaptive value in view of the trophic state of the species' habitat.
Table 1-I. A list of symbols used throughout this thesis and their definitions.
| Symbol | Definition | Units |
| Á | Growth rate | h-1 |
| Ámax | Maximum specific growth rate | h-1 |
| P | Phosphorus concentration | ÁM P |
| Pi | Inorganic P concentration | ÁM P |
| Ks | Half-saturation constant for growth, Pi concentrationat which growth is half-saturated (Á = 1/2 Ámax) | ÁM P |
| Pt | Concentration of Pi at Á = 0 | nM P |
| R* | Residual concentration of Pi | ÁM P |
| t | Time delay in growth after a large P pulse | h |
| T | Growth potential, the period over which Ámax may be sustained by storage without any external nutrient supply | days |
| SRP | Soluble reactive phosphate | ÁM P |
| D | Dilution rate of continuous culture | h-1 |
| Prot | Concentration of cellular protein | mgProt L-1 |
| Vp | P uptake rate | Ámol P mg Prot-1 h-1 |
| Vi,max | Maximum initial (0 - 5 min) uptake rate of P in cells from steady-state | Ámol P mg Prot-1 h-1 or pmol P cell-1 h-1 |
| Km | Half-saturation constant for P uptake,P concentration at which uptake is half-saturated (V = 1/2 Vi,max) | ÁM P |
| Vi,max/Km | Affinity for P uptake | |
| Vlt,max | Maximum long term (20 - 30 min) P uptake rate in cells from steady state | pmol P cell-1 h-1 |
| Umax | P uptake rate relative to internal P quota (Vi,max/Qp) | h-1 |
| Qp | Cellular P quota | Ág P mg Prot-1 |
| Á'max | Apparent Ámax that would occur if Qp became infinite | h-1 |
| Qmax | Qp at Ámax | Ág P mg Prot-1 |
| Q'max | Maximum Qp after a saturating P addition | Ág P mg Prot-1 |
| Q0 | Cellular P quota at Á = 0 | Ág P mg Prot-1 |
| R | Storage ability | (Q'max/Q0) |
| DW | Dry weight | mg |
| Yield | Production of cellular DW on P | mg DW Ág Qp-1 |
| MFP | 3-0-methylfluoresceinphosphate | ÁM |
| MF | 3-0-methylfluorescein | ÁM |
| APA | Alkaline phosphatase activity | Ámol P mg Prot-1h-1 |
| Po | Organic P concentration | ÁM P |
| APAmax | Maximum APA | Ámol P mg Prot-1 h-1 |