Phosphorus uptake and growth kinetics of
two planktonic desmid species
Elly Spijkerman & Peter F.M. Coesel
Abstract
Introduction
Materials and methods
Results
Discussion
Published in the European Journal of Phycology
Phosphorus (P) uptake and growth kinetics under continuous P limitation in chemostat culture were studied in two planktonic desmid species: Cosmarium abbreviatum originating from an oligo-mesotrophic lake, and Staurastrum pingue from a eutrophic lake. Under stringent P limitation (steady-state growth rates up to 0.015 h-1) C. abbreviatum showed a higher affinity for P uptake and for growth than S. pingue. This competitive advantage over S. pingue disappeared when P limitation became less severe (growth rates above 0.015 h-1), due to a sharp decline in the affinity of C. abbreviatum for P. At all growth rates tested C. abbreviatum showed a higher biomass yield per unit of P than S. pingue. As S. pingue had double the maximum growth rate of C. abbreviatum and displayed higher maximum P uptake rates, it is likely to be better adapted to a eutrophic, dynamic environment where P release is predominantly in pulses.
An investigation into the ecophysiological characteristics underlying the distribution patterns of planktonic desmid species showed that taxa predominantly encountered in eutrophic habitats have higher intrinsic growth rates than taxa characteristic of oligo-mesotrophic environments (Coesel & Wardenaar 1990). At a temperature of 20 °C, Cosmarium abbreviatum var. planctonicum (oligo-mesotrophic) exhibited a lower photosynthetic capacity and a lower maximum growth rate than Staurastrum chaetoceras (eutrophic). This was possibly linked to the presence of a copious extracellular mucilaginous envelope that required part of the cellular photosynthetic energy for its construction and maintenance (Coesel & Wardenaar 1994). So far, in desmids, distinct extracellular mucous envelopes have been found exclusively in oligo-mesotrophic taxa (Coesel 1994). Obviously, a relatively low photosynthetic efficiency and intrinsic growth rate as found in C. abbreviatum is of competitive disadvantage in a eutrophic environment populated by r-strategists (Reynolds 1988). However, the almost complete absence of S. chaetoceras in oligo-mesotrophic lakes is not readily explained by its photosynthetic characteristics. Its absence from these habitats is more likely to result from having mechanisms for uptake and conversion of scarce nutrients inferior to those in oligo-mesotrophic taxa. Since total phosphorus and total nitrogen concentrations can be interpreted as part of the definition of the eutrophication level (trophic state) of a lake (OECD 1982), uptake and growth kinetics with respect to these elements reflect the adjustment of species to the total nutrient supply of the lake (Hecky & Kilham 1974). Competition for these nutrients can be of major importance in determining the species composition of natural populations (Kilham & Tilman 1979).
To test this hypothesis for planktonic desmids, we planned to grow some species (including both taxa mentioned above) in chemostat culture under phosphorus limitation. Due to some trivial technical problems (contamination) with starting S. chaetoceras in chemostat culture, we initially obtained data on another Staurastrum species isolated from the same eutrophic site, i.e. S. pingue to compare with C. abbreviatum. In batch culture experiments, maximum specific growth rates of S. pingue and S. chaetoceras proved to be closely similar, i. e. 1.15 d-1 and 1.23 d-1 respectively, versus 0.47 d-1 in C. abbreviatum (Coesel & Wardenaar 1990).
Algal isolates— The experiments were carried out with Cosmarium abbreviatum Raciborski var. planctonicum W. & G.S. West, clone AO 116, isolated from mesotrophic Lake Maarsseveen (I), in 1987, and Staurastrum pingue Teiling, clone AO 234, isolated from eutrophic Lake IJmeer, also in 1987. For descriptions of these lakes, see Swain et al. (1987) and Berger & Sweers (1988), respectively or Table 7-I of this thesis. Cell volumes for both species are comparable, ranging from 2000-5000 µm3, dependent on culturing conditions.
Culture conditions— The algae were grown in continuous flow 1 L culture vessels, as described in Coesel & Wardenaar (1994) and also in chapter 1. The culture was continuously aerated with sterilized air (~70 L h-1). Although cultures were not axenic, bacterial biomass (stained by acridine and counted under a fluorescence microscope, according to Hobbie et al. 1977) was found to be less than 1% of the algal biomass. All experiments were done under continuous light, with an average photon flux density (PFD) measuring only photosynthetically active radiation (PAR) in the culture vessel of 60-80 µmol m-2 s-1, at 20 ± 1 °C. Dilution rates (D) varied from 3 to 20 ml h-1, the latter value corresponding with almost maximum growth rate (µmax) in C. abbreviatum, and with about half µmax in S. pingue. Chemostat cultures were considered to be in steady state (D = µ) when total cell volume and optical density at 750 nm varied by less than 5% over a period of two (in the case of the lowest growth rate) to five total replacements of the culture vessel volume. The flow-through medium was based on Woods Hole medium (Nichols 1973), in which Tris buffer was substituted by 2 mM Hepes, and pH was set at 7.0-7.2. Phosphate (as K2HPO4) was lowered to 5 µM and potassium limitation was avoided by adding 0.1 mM KCl. To prevent nitrogen limitation, nitrate concentration was increased to 2.0 mM NaNO3. Silicon was left out because of its interference with phosphorus (P) during the P measurements and since it did not affect optimal growth. To prevent precipitation of P by iron in the flow-through medium, 5 µmol FeEDTA was directly added to the culture vessel once or twice a week (dependent on the dilution rate).
Uptake experiments— Phosphorus uptake experiments were performed with 2-fold diluted culture material from steady-state conditions. Dilution was with P- and FeEDTA-free culture medium. In this way the already low external P concentration was further decreased without possible damage to the cells by centrifugation. For determination of initial uptake rates cells were pre-incubated in a water bath at 20 °C for 15-30 min (incident PFD: 2.5 µmol m-2 s-1). During uptake, cells were subjected to an incident PFD of 17 µmol m-2 s-1. The cell suspension was pulsed with 0.05-0.5 µCi [32P]PO43-, carrier-free K3PO4 (Amersham, England) and a varying amount of K2HPO4, to a final concentration ranging from 0.5 to 10.0 µM. At t = 0, 30, 60 and 300 s, the uptake was stopped with 0.2 M LiCl, immediately after which the cells were filtered onto Whatman GF/C filters. The filters were embedded in Insta-Gel-II (Packard) and counted in a liquid scintillation analyser 1600 TR (Packard). The uptake rate (V) at different initial inorganic phosphorus (Pi) concentrations was determined from linear regression following Riegman & Mur (1984b). These uptake rates were plotted against the initial phosphorus concentrations and, according to uptake kinetics of the Michaelis-Menten type (e. g. Turpin 1988):
V = Vi,max * ( Pi / (Km + Pi)) (1)
a curve was fitted using a non-linear regression analysis. In this way, the maximum uptake rate (Vi,max) and half saturation constant for uptake (Km) were determined. V was also plotted against V/Pi, i.e. a Hofstee (1952) plot, to see whether more than one uptake system was involved. To determine uptake kinetics of P-saturated cells, material from continuous flow culture was incubated in P-sufficient, standard Woods Hole medium (50 µM P) and grown in batch culture under continuous light (incident PFD of 50 µmol m-2 s-1) at 20 ± 1 °C. After 1 week cells were washed and resuspended in P-free culture medium. Uptake rates were then measured as described above. Cellular storage capacity was assessed using a 2-fold diluted steady-state culture suspension which was pulsed with (unlabeled) K2HPO4 to a final concentration of 50 µM P. After 24 h the cellular P concentration was determined. During this time the cells were kept in the light (incident PFD of 60 µmol m-2 s-1) at 20 °C and aerated. Assuming the cells to be saturated with P, the quota thus determined is considered to be at its maximum value (Qmax). The cellular storage capacity, expressed by the luxury consumption coefficient R (Turpin 1988), is defined by:
R = Qmax / Qp (2)
in which Qp is the steady-state cell quota for P.
Analytical methods— Total P content of the cell suspension was determined after digestion with K2S2O8 (added in excess) and 0.15 M H2SO4 at 100 °C for 1 h. The concentration of external soluble reactive phosphorus (SRP) in the culture vessel was assessed after centrifugation (1500 g, 10 min). Total and soluble P were then measured according to Murphy & Riley (1962). The cellular P concentration (Qp) was calculated by subtracting the SRP fraction from total P content. Protein was measured according to Lowry et al. (1951), using washed cells to avoide disturbance by Hepes during this measurement. Cell numbers and mean cell volumes were determined with a Coulter Multisizer. Dry weight was measured after filtration on a Whatman GF/C filter, drying the filter at 70 °C for 48 h. Carbohydrates were measured with anthrone, using glucose as a standard (Hassid & Abraham 1957).
Calculation of inorganic phosphorus— Because SRP concentrations in the culture vessel were often too low to be measured precisely, dissolved Pi was also calculated by coupling the kinetics of steady-state nutrient uptake with the kinetics of growth as represented by Droop's equation
µ = µ'max (1 - (Q0 / Qp) ) (3)
in which Q0 is the minimum cell quota of P (Qp at µ = 0) and µ'max is the apparent maximal growth rate that would occur if Qp became infinite. Since in steady-state condition the rate of cell quota increase due to uptake equals the dilution of cell quota due to growth (e. g. Turpin 1988) it follows that
V = µ . Qp (4)
Because V is also separately measured at different Pi concentrations (Equation 1), the actual Pi concentration for a given steady-state condition can be calculated. These Pi values were used for the determination of the maximum growth rate (µmax) and half saturation constant for growth (Ks) according to the model of Monod:
µ = µmax * (Pi - P / (Ks + Pi - Pt)) (5)
where Pt is the concentration of Pi at which growth rate equals zero (Tilman & Kilham 1976). According to Sommer (1988) the residual nutrient concentration (R*) in the culture suspension, which is an important measure for competitive ability, may be calculated from:
R* = (µ . Ks / µmax - µ) + Pt (6)
Statistical tests— Significance of observed differences in data sets was tested by means of a Kruskal-Wallis test. Correlations were tested with Spearman correlation and curve fitting with an ANCOVA (Sokal & Rohlf 1981).
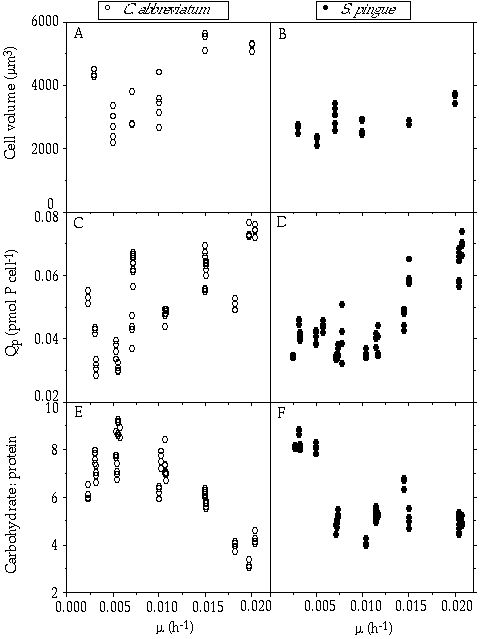
Cellular yield— The relationship between mean cell volume and steady-state growth rate (Figures 2-1A, B) shows that there is a slight tendency for an increase in cell volume with growth rate and for a generally somewhat larger cell volume of C. abbreviatum as compared with S. pingue. A rather high variance in the data for each species as a function of growth rate is also shown. This may explain part of the high variance in cellular P content in relation to growth rate (Figures 2-1C, D). Despite the high variance there is a distinct tendency for an increasing cell quota of P with growth rate, roughly according to the Droop model (e. g. Kohl & Nicklisch 1988). More or less in parallel with this increasing P content, a gradual decline in the cellular carbohydrate : protein ratio was found (Figures 2-1E, F). Because of the variable cell size, cellular yield per unit of P is expressed as mean dry weight per unit of cellular P (Table 2-I). Over the whole range of growth rates there is a significant difference (P < 0.001) between the species, C. abbreviatum producing more biomass on the same amount of P. In both species, yields at the lowest growth rate appeared significantly higher (P < 0.01) than at the highest growth rate tested.
Figure 2-1. Different parameters of Cosmarium abbreviatum and Staurastrum pingue in relation to growth rate (µ): (A,B) mean cell volumes; (C,D) cellular phosphorus contents (Qp); (E,F) cellular carbohydrate : protein ratio (by weight).
Table 2-I. Yield values of C. abbreviatum and S. pingue at different steady-state growth rates (µ) expressed as mg dry weight per µg cellular phosphorus (mean yields ± SD, number of values in parentheses).
|
µ (h-1) |
C. abbreviatum |
S. pingue |
||
|
0.003 |
1.73 ± 0.43 |
(14) |
0.97 ± 0.20 |
(15) |
|
0.005 |
1.26 ± 0.19 |
(10) |
0.89 ± 0.05 |
(9) |
|
0.007 |
1.19 ± 0.17 |
(15) |
1.01 ± 0.10 |
(19) |
|
0.010 |
1.32 ± 0.10 |
(9) |
0.99 ± 0.63 |
(15) |
|
0.015 |
1.21 ± 0.08 |
(14) |
0.88 ± 0.20 |
(10) |
|
0.020 |
1.09 ± 0.16 |
(13) |
0.70 ± 0.05 |
(15) |
Uptake rates— In Figure 2-2 the uptake rate of C. abbreviatum growing at µ = 0.020 h-1 is plotted against the initial P concentration. Also shown is a Hofstee plot, which fits the data better than a single Michaelis Menten curve (P < 0.005). It suggests that there are two different uptake systems. One has a relatively low Vi,max and Km, and the second becomes active when the external concentration rises above 4.5 µM P, with a higher Vi,max and Km (Tables 2-II and 2-III). These two uptake systems have a different affinity for P and are thus designated respectively as a high-affinity system (HA) and a low-affinity system (LA), the affinity being defined as Vi,max/Km (e. g. Healey 1980). The presence of two different uptake systems could only be rationalized in this way for C. abbreviatum at the highest growth rate tested.
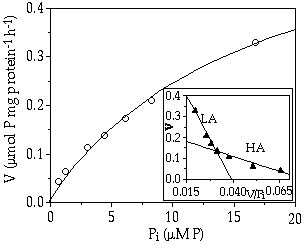
Figure 2-2. Uptake rate (V) of Cosmarium abbreviatum growing at 0.020 h-1 in relation to different initial inorganic phosphorus concentrations (Pi). Inset: Hofstee plot of this relationship showing a high-affinity (HA) and a low-affinity (LA) uptake system.
Table 2-II. Maximum uptake rates (Vi,max) in µmol P mg protein-1 h-1, half saturation constants (Km) in µM P, and affinities (Vi,max/Km) of C. abbreviatum and S. pingue at different steady-state growth rates (µ) in h-1 (mean values ± SD of three replicates). Values obtained with single Michaelis-Menten kinetics.
|
C. abbreviatum |
S. pingue |
|||||
|
µ |
Vi,max |
Km |
Vi,max/Km |
Vi,max |
Km |
Vi,max/Km |
|
0.003 |
0.31 ± 0.07 |
1.1 ± 0.4 |
0.34 ± 0.22 |
1.25 ± 0.16 |
7.4 ± 1.1 |
0.17 ± 0.03 |
|
0.007 |
0.34 ± 0.01 |
1.5 ± 0.8 |
0.27 ± 0.14 |
1.50 ± 0.31 |
12.6 ± 3.0 |
0.12 ± 0.01 |
|
0.010 |
0.40 ± 0.11 |
1.3 ± 0.5 |
0.33 ± 0.06 |
1.04 ± 0.13 |
11.6 ± 4.9 |
0.11 ±0.01 |
|
0.015 |
0.29 ± 0.09 |
2.2 ± 0.6 |
0.14 ± 0.06 |
0.67 ± 0.03 |
4.1 ± 0.4 |
0.17 ± 0.01 |
|
0.020 |
0.59 ± 0.01 |
12.5 ± 1.8 |
0.05 ± 0.01 |
0.84 ± 0.13 |
4.4 ± 0.1 |
0.19 ± 0.03 |
Table 2-III. Values additional to those shown in Table 2-II, referring to the high-affinity uptake system obtained from Hofstee plots.
|
C. abbreviatum |
|||
|
µ |
Vi,max |
Km |
Vi,max/Km |
|
0.020 |
0.27 ± 0.08 |
3.7 ± 2.5 |
0.09 ± 0.04 |
Over the whole range of growth rates, the maximum uptake rate in S. pingue is distinctly higher than in C. abbreviatum (P < 0.05, Table 2-II). At the lowest growth rates the values differ by a factor of 4. The affinity for P was independent of growth rate for S. pingue, but in C. abbreviatum the affinity increased with decreasing growth rate (P < 0.05). However at the higher growth rates tested the affinity for P in C. abbreviatum is inferior to that in S. pingue (P < 0.05) while at lower growth rates the opposite is the case (P < 0.005). The low affinity in C. abbreviatum at µ = 0.020 h-1 (near its µmax) is caused by the high Km value of its LA uptake system. At external P concentrations below 4.5 µM its HA uptake system will be operational (Figure 2-2), but even this HA system has a lower affinity than present in S. pingue at that growth rate (P < 0.05).
Uptake rates of P-saturated cells are given in Table 2-IV. A comparison with Table 2-II shows that affinity values are dramatically decreased and almost equal in both species. Vi,max values are very much lower than in Table 2-II, though S. pingue is still superior to C. abbreviatum (P < 0.05).
Table 2-IV. Maximum uptake rates (Vi,max) in µmol P mg protein-1 h-1, half saturation constants (Km) in µM P, and affinities (Vi,max/Km) of C. abbreviatum and S. pingue under phosphorus-sufficient conditions in batch culture (mean values ± SD, number of values in parentheses).
|
Vi,max |
Km |
Vi,max/Km |
||
|
C. abbreviatum |
0.07 ± 0.01 |
2.3 ± 1.3 |
0.04±0.02 |
(4) |
|
S. pingue |
0.15 ± 0.00 |
3.2 ± 0.4 |
0.05±0.01 |
(2) |
Storage capacity— The storage capacity expressed as R (Equation 2) is given in Table 2-V. Whereas in C. abbreviatum a significant increase in storage ability with increasing growth rate is shown (P < 0.001), in S. pingue no such correlation was found. On the contrary, there was a suggestion of a decreasing storage capacity with a further increase in growth rate.
Table 2-V. Phosphorus storage capacities (R) of C. abbreviatum and S. pingue, based on Qmax values after 24 h exposure to phosphorus-sufficient conditions and steady-state Qp values at different growth rates (mean values ± SD, number of values in parentheses). Where no values are given Qmax was not determined.
|
µ (h-1) |
C. abbreviatum |
S. pingue |
||
|
0.003 |
6.4 ± 1.0 |
(12) |
10.1 ± 2.4 |
(12) |
|
0.007 |
__ |
|
14.3 ± 2.7 |
(12) |
|
0.010 |
__ |
|
13.7 ± 1.2 |
(8) |
|
0.015 |
9.5 ± 2.1 |
(12) |
__ |
|
|
0.020 |
15.2 ± 2.5 |
(12) |
7.4 ± 0.6 |
(8) |
Growth versus external inorganic phosphorus concentration— The relationship between growth rate and Pi concentration in the culture vessel (calculated according to Equations 1 and 4) is shown in Figure 2-3. According to Equation 5, Ks values for C. abbreviatum and S. pingue were determined from these plots as 0.011 and 0.038 µM P respectively and µmax values as 0.021 and 0.043 h-1 respectively. For S. pingue Pt was determined to be 0.006 µM P, whereas for C. abbreviatum this concentration was near zero. Based on the Ks and µmax values the residual nutrient concentration R* was calculated according to Equation 6 (Table 2-VI). It is shown that at growth rates less than µ = 0.015 h-1 the ability to deplete the culture medium of P is higher in C. abbreviatum than in S. pingue, whereas above that value the opposite is the case.
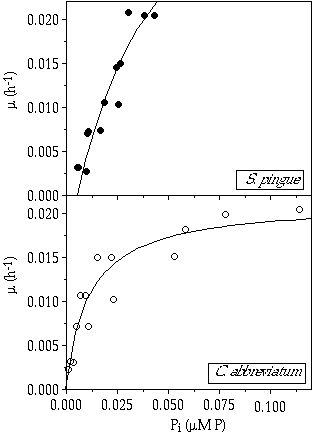
Figure 2-3. Growth rates (µ) of Cosmarium abbreviatum and Staurastrum pingue in relation to the inorganic phosphorus concentration in the culture vessel (Pi); curves fitted to the Monod model.
Table 2-VI. Residual inorganic phosphorus concentrations (R*, in µM P) left by C. abbreviatum and S. pingue in the culture vessel, calculated for different steady-state growth rates according to Equation 6.
|
µ (h-1) |
C. abbreviatum |
S. pingue |
|
0.003 |
0.0018 |
0.0088 |
|
0.005 |
0.0034 |
0.0109 |
|
0.007 |
0.0055 |
0.0133 |
|
0.010 |
0.0100 |
0.0174 |
|
0.015 |
0.0275 |
0.0260 |
|
0.020 |
0.2200 |
0.0386 |
Three physiological attributes are usually considered essential for determining the competitive ability of phytoplankters with respect to a limiting nutrient: 1) the ability to acquire the resource in question (affinity for the resource), 2) the ability to use the resource for the production of new cells (yield from the resource), and 3) the ability to store the resource (storage capacity) (see e. g. Sandgren 1988).
The affinity for P, expressed as the ratio Vi,max/Km, represents the initial slope of uptake as a function of external orthophosphate concentration, and so is an indicator of competitive position in uptake. The maximum uptake rate Vi,max will become an important ecophysiological attribute under circumstances of temporarily high ambient concentrations of orthophosphate. When comparing the two species investigated for their P uptake parameters (Table 2-II) it is concluded that C. abbreviatum, according to its high affinity values, will have a competitive advantage under conditions of permanent, stringent P limitation. S. pingue, on the other hand, in view of its higher Vi,max values, would benefit more from P pulses. Only a few data on P uptake kinetics in desmid species are available in the literature. Healey & Hendzel (1988) compared Cosmarium subcostatum Nordstedt with Staurastrum paradoxum Meyen (the latter has to be considered a taxonomically meaningless catch-all species, see e. g. Brook 1960). For S. paradoxum, Umax (=Vi,max/Qp ) values below 2 µmol P µmol cell P-1 h-1 can be inferred and for C. subcostatum values between 2 and 10. These ranges are roughly in agreement with those we calculated for C. abbreviatum and S. pingue (i. e. 1-4 and 2-6 µmol P µmol cell P-1 h-1), respectively. In Olsen (1989) for Staurastrum luetkemuellerii Donat et Ruttner (a species closely related, if not identical to S. pingue, see Coesel 1992) at growth rates up to c. 0.017 h-1, Umax values are to be gathered of c. 0.2-1.2 µmol P µmol cell P-1 h-1. When considering affinity expressed as Umax/Km , the following ranges were determined: C. abbreviatum 0.2-1.6, S. paradoxum 0.1-0.7, C. subcostatum 0.2-0.8, S. pingue 0.3-0.6 and S. luetkemuellerii 0.1-3 L µmol P-1 h-1. In conclusion, with respect to uptake parameters, the two desmid species used in the present study are broadly comparable with those investigated by others (for an overview, see Table 2-VII). At low growth rates, in C. abbreviatum affinity for P is distinctly higher and maximum uptake rate lower than in most other species. The intermediate position of S. paradoxum (if identical to S. cingulum) and C. subcostatum in the above series of affinity values is in agreement with our experience regarding the distribution of these two species in the field both being encountered mainly in mesotrophic lakes.
With respect to storage capacity, expressed as Qmax/Qp (Table 2-V), at the lower growth rates S. pingue seems to be superior to C. abbreviatum whereas at the highest growth rate tested just the opposite is the case. The higher storage ability of S. pingue at low growth rates may be of advantage in a dynamic environment where P release is predominantly in pulses. The relatively high storage capacity of C. abbreviatum at µ = 0.020 h-1 is related to the induction of a second uptake system. As yet the ecological relevance is rather obscure since maximum uptake rate under the highest growth rate is lower than in S. pingue (and, no doubt, many other phytoplankton species), so it is questionable whether there will be much opportunity for storage at all.
Regarding biomass yield per unit of P, C. abbreviatum appears to be somewhat more efficient than S. pingue over the whole range of growth rates tested (Table 2-I). Special attention is drawn to the remarkably high yield in C. abbreviatum at the lowest growth rate, when the culture suspension was of high viscosity (visually apparent from more laborious aeration). The high viscosity was brought about by a large amount of mucilage produced by the cells. C. abbreviatum is characterized by a copious mucilaginous cell envelope in contrast to S. pingue, in which cells are only partially surrounded by a thin mucilage layer (Coesel 1994). With respect to the viscous cell suspension under discussion, apart from the mucilage-enveloped cells, numerous smaller, free-floating mucilage globules could also be observed (compare figure 12 in Coesel 1994). The mucilaginous substance produced by desmid cells is known to consist mainly of specific polysaccharides (Surek & Sengbusch 1981, Smestad & Viera 1994). Obviously in C. abbreviatum the production of these polysaccharides under extreme P limitation is enhanced to such a level that the viscosity of the culture medium is considerably increased. Presumably, it also explains the high cellular yield under these growth conditions: the high dry weight value per unit of P being caused in large part by surplus polysaccharides (which were not adequately quantified by the anthrone reagent used).
The relationship between cellular P content and growth rate appears only roughly to fit the Droop model (Figures 2-1C, D). It has to be stressed, however, that in case of S. pingue only the lower part of its growth rate range was analysed (up to about half µmax). An approximation of the minimum cell quota Q0 (Qp when µ = 0) by fitting the Droop model (Equation 4) to the Qp data in Figures 1C and D gives Q0 = 0.465, and Q0 = 0.806 µg P mg DW-1 for C. abbreviatum and S. pingue respectively. The Q0 value Olsen (1989) found for S. luetkemuellerii (0.925 µg P mg DW-1, assuming a carbon-dry weight conversion factor of 0.5, see Reynolds 1984) is very close to that of S. pingue. Also the yield values of S. pingue and S. luetkemuellerii at growth rates up to c. 0.02 h-1 (c. 0.5 d-1 ) are similar, i. e. they range from c. 0.7 to 1.0 mg DW per µg cellular P. In contrast, yield in C. abbreviatum at low growth rates (0.07 d-1) is more similar to that in C. subcostatum, i. e. 1.7 and 2.0 mg DW µg P-1 respectively.
The µmax values for C. abbreviatum and S. pingue as derived from their cellular P quota and P uptake rates at different steady-state growth rates are very close to those measured directly under nutrient-sufficient growth conditions (Coesel & Wardenaar 1990, Coesel & Wardenaar 1994). As noted already in the methods section, the residual inorganic P concentration in the culture vessel (R*) is considered to be the most appropriate parameter for determining competitive ability: the species with the lowest R* for the limiting resource displaces all competitors (e. g. Tilman 1977, Tilman et al. 1981). The R* values we calculated for C. abbreviatum and S. pingue (Table 2-6) unequivocally show that under permanent, stringent P limitation (at growth rates up to 0.015 h-1) C. abbreviatum will outcompete S. pingue while this competitive advantage disappears when P limitation becomes less severe.
In conclusion, the two desmid species investigated are distinctly different in their P uptake and growth kinetics. C. abbreviatum, characterized by a relatively high affinity for P for both uptake and growth, will have a competitive advantage in an environment where phytoplankton growth is permanently and equably P limited (i.e. it is a so-called affinity specialist sensu Crowley 1975). S. pingue, on the other hand, with its relatively high maximum P uptake rate and high maximum growth rate, will benefit in a more dynamic environment where P release is in marked pulses, and so may be classified as a velocity specialist (Crowley 1975).
Table 2-VII.Ranges of maximum P-based specific uptake rate (Umax) in h-1, affinity (Umax/Km) in L µmol P-1 h-1, maximum uptake rates (Vmax) in µg P mg C-1 h-1 and affinity (Vmax/Km) from different authors concerning desmid species.
|
Species |
Umax |
Umax/Km |
Vmax |
Vmax/Km |
References |
|
S. luetkemuellerii |
0.2-1.2 |
0.1-3 |
1.0-2.7 |
0.02-0.25 |
Olsen (1989) |
|
C. subcostatum |
2-10 |
0.2-0.8 |
6.2-20 |
0.02-0.08 |
Healey & Hendzel (1988) |
|
S. paradoxum |
0.2-1.5 |
0.1-0.7 |
2-3 |
0.02-0.05 |
" |
|
C. abbreviatum |
1.2-3.6 |
0.2-1.6 |
2.5-6 |
0.04-0.1 |
This thesis (chapter 2) |
|
S. pingue |
1.4-5.9 |
0.3-0.6 |
8.8-20 |
0.05-0.09 |
" |
|
S. chaetoceras |
1.2-4.0 |
0.4-0.6 |
12-15 |
0.07-0.1 |
This thesis (chapter 3) |