Competition for phosphorus between planktonic
desmid species in continuous-flow culture
Elly Spijkerman & Peter F.M. Coesel
Abstract
Introduction
Materials and methods
Results
Discussion
Published in the Journal of Phycology.
When grown under stringent P limitation, affinity for P uptake and growth in Staurastrum pingue Teil. and Staurastrum chaetoceras (Schr.) G.M. Smith (both originating from eutrophic lakes) were of the same magnitude, whereas these parameters for Cosmarium abbreviatum Rac. var. planctonicum W. & G. S. West (isolated from a meso-oligotrophic lake) were significantly higher in value. On the other hand, at all growth rates tested, maximum P uptake rates were lower in C. abbreviatum than in the two Staurastrum species. The outcome of competition between either Staurastrum species and C. abbreviatum in mixed chemostats under different levels of continuous P limitation was in agreement with what could be predicted from the species-specific affinity parameters: Staurastrum was outcompeted at dilution rates lower than 0.012 h-1, calculated to correspond with external inorganic P concentrations lower than 0.02 çM P, but won out at higher dilution rates. When P was added in two pulses of 2.5 çM a week instead of continuously S. chaetoceras outcompeted C. abbreviatum at a slow rate. When P was supplied as a daily pulse of 0.7 çM, a stable coexistence of S. chaetoceras and C. abbreviatum was established, Staurastrum predominating the culture in cell numbers for c. 85%. The results show that P uptake and growth characteristics of the three species can predict the outcome of competition under various P-limited conditions. Specific growth kinetic parameters as found in this study may also explain distribution patterns of the species observed in the field.
Natural selection is thought to favour those algae whose nutrient uptake and growth characteristics are best suited to environmental conditions, so that species originating from habitats differing in trophic state will exhibit different affinities for growth and nutrient uptake kinetics (Hecky & Kilham 1974, Tilman 1977, Kilham & Tilman 1979). Consequently, nutrient uptake and growth kinetics may help to explain the distribution of algal species in the field. Since 1980s a lot of experimental documentation has been presented concerning the importance of nutrient uptake and growth kinetic parameters in determining the outcome of phytoplankton competition (e. g. Holm & Armstrong 1981, Tilman 1981, Kilham 1984, Healey & Hendzel 1988, Grover 1989a, b, 1991c, Olsen et al. 1989, Nicklisch et al. 1991). Yet, what was stressed already by Tilman et al. (1982), that is, the need for laboratory studies designed specifically to test the validity of conclusions derived from correlation analyses in the field, still holds. Remarkably enough, none of the experimental studies focussed on ecophysiological differences among species whose distribution in the field may be linked to the trophic state of the habitat. Most of the preceding experimental studies include species isolated from the same lake. In addition, experiments were often carried out with species belonging to different algal groups (e. g. cyanobacteria, diatoms, green algae) so that physiological differences observed may be inherent to the groups in question rather than specific to the species level. Coesel & Wardenaar (1990) determined growth rates of 12 planktonic desmid species in relation to temperature and irradiance. They found significantly lower maximum growth rates in species characteristic of oligotrophic lakes as compared to those that peak in eutrophic ones. This potential disadvantage to the oligotrophic species is likely to be compensated for by superiority in another physiological characteristic-for instance, the uptake of scarce nutrients. As phoshate (P) is often the limiting nutrient for algal growth in freshwaters during the summer period (e.g. Kalff & Knoechel 1978), this nutrient was chosen to test this hypothesis. In the present study, three planktonic desmid species were grown under phosphorus-limited conditions. One of these taxa, Cosmarium abbreviatum var. planctonicum is characteristic of an oligo-mesotrophic environment, whereas Staurastrum pingue and Staurastrum chaetoceras peak in eutrophic water bodies (Coesel 1994). The species were chosen as experimental subjects because of by their roughly comparable cell dimensions, since cell size is an important parameter determining P uptake kinetics (Smith & Kalff 1982). Possible differences in kinetic characteristics, caused by cellular surface area-to-volume ratios are thus reduced to a minimum. We have shown (chapter 2) that under stringent P limitation C. abbreviatum had a higher affinity for P uptake and growth than S. pingue. The maximum P uptake rates of S. pingue were higher than those of C. abbreviatum at all growth rates tested. For C. abbreviatum the total range of growth rates was examined, but for S. pingue only its kinetic characteristics up to about half its maximum growth rate (çmax) were determined. Therefore, an extended set of kinetic data is provided here, including those for S. chaetoceras. The species-specific uptake and growth kinetics from the unialgal P-limited chemostats were used to predict the outcome of competition. This was tested in mixed continuous flow cultures under both continuously and pulsed P-limited conditions. As far as we can determine, this is the first study of algal growth kinetics under P limitation comparing species with comparable cell size and belonging to the same taxonomic family, but occurring under trophically different conditions in the field.
The experiments were performed with Staurastrum chaetoceras (Schr.) G.M. Smith, clone AO 36, and Staurastrum pingue Teil., clone AO 234, both isolated from the alkaline eutrophic Lake IJmeer (Berger & Sweers 1988) and Cosmarium abbreviatum Rac. var. planctonicum W. & G. S. West, clone AO 116, isolated from the alkaline, oligo- mesotrophic Lake Maarsseveen (I) (Swain et al. 1987). See for a description of both lakes also Table 7-I in chapter 7 of this thesis. All clones were taken from the desmid collection at the Department of Aquatic Ecology.
Culture conditions and analytical methods The species were cultured at 20 Ý 1 ¯C in 1 L continuous-flow culture vessels. The inflow medium for continuously P-limited cultures contained 5 çM P; the inflow medium for the pulsed P-limited cultures contained no phosphorus. For details about the continuous-flow device, see Coesel & Wardenaar (1994) and also chapter 1. For details about the composition of the medium, see chapter 2. The range of dilution rates (D) tested varied from 0.003 to 0.035 h-1 for both Staurastrum species and from 0.003 to 0.020 h-1 for Cosmarium abbreviatum. Circular fluorescent tubes provided an average photosynthetically active radiation (PAR) in the culture vessel of 60-80 çmol m-2 s-1, which proved to be saturating for growth. Illumination of the unialgal cultures was continuous. Cultures were not axenic but bacterial biomass (estimated by acridine staining and counting under a fluorescence microscope) was negligible (<1% of algal biomass). Algal cells were counted with a Coulter Multisizer. Chemostat cultures were considered to be in a steady state (D = ç) when algal biomass varied less than 5% over at least two (in case of the lowest dilution rate) to five renewals of the culture vessel volume. At steady-state conditions, protein was measured according to Lowry et al. (1951). Dry weight was measured by concentrating culture material on preweighed GF/C filters, which were dried at 70 ¯C for 48 h. Cellular P concentrations were determined in the pellet after centrifugation (1500 g, 10 min); total cellular P was measured after digestion with K2S2O8 and H2SO4 at 100 ¯C for 1h. The external soluble reactive phosphorus (SRP) was assessed from the supernatant after centrifugation (1500 g, 10 min). Both fractions were measured according to Murphy & Riley (1962). By dividing total cellular P concentration by cell density, cellular P quota (Qp) were obtained. Tests for significance were done following Sokal & Rohlf (1981). In the data, no homogeneity in variance was obtained so comparing group means was done with a Kruskal and Wallis test and correlations were conducted with a Spearman test. Mean cellular dry weights and protein contents over the whole range of growth rates measured are given in an appendix to enable conversion of the data.
Uptake experiments Uptake experiments were performed with culture material from steady-state conditions, which was twofold diluted with P-free culture medium and pulsed with different inorganic phosphorus (Pi) concentrations containing 32P as described in chapter 2. Initial Pi concentrations ranged from 0.5 to 30 çM. Cellular 32P contents were determined at t = 0, 30, 60 and 300 s, and initial uptake rates (V) for every initial Pi concentration were calculated from linear regression, following Riegman & Mur (1984b). By curve fitting to the Michaelis-Menten equation
V = Vi,max * ( Pi / (Km + Pi)) (1)
maximum uptake rate (Vi,max) and half-saturation constant for uptake (Km) were computed.
Calculation of chemostat culture parameters In the cultures growing at low dilution rates SRP concentrations in the culture vessel were too low to be measured accurately with the method of Murphy & Riley (1962); therefore, the external inorganic P concentrations were calculated from steady-state cellular quota and initial uptake rates, following Turpin (1988). In steady state the net uptake rate of the limiting nutrient equals the dilution of cell quota due to growth:
V = (ç) (Qp). (2)
From Equation 1 the relationship between Pi and V had been obtained for a steady-state situation; thus, the actual Pi concentration for this steady-state condition in the culture vessel may be derived by combining Equations 1 and 2, assuming that gross and net Pi influx are equal. These calculated Pi values were used for the determination of the growth rate versus external Pi concentration expressed as a modified Monod model:
ç = çmax * (Pi - Pt) / (Ks + (Pi - Pt)) (3)
where Pt is the concentration of Pi at ç = 0 (Tilman & Kilham 1976) and Ks is the half saturation constant for growth. The cellular P quota were related to the growth rate according to the Droop relation:
ç = ç'max * (1 - ( Q0 / Qp) ) (4)
where ç'max is the apparent maximal growth rate that would occur if Qp became infinite and Q0 is the cellular quota at ç = 0.
Competition experiments Competition between one Staurastrum species and C. abbreviatum was followed under both continuous and pulsed P limitation. To resemble natural conditions more closely, illumination in the competition experiments was applied under a 16:8 h LD regime. Other growth conditions were as described for single-species chemostat cultures. Algal strains were precultured in chemostats under the desired P limitation. Experiments were then started by mixing two species in a 1-to-1 cell number ratio. Cell numbers were counted one to three times a week using a 1 mL capacity Sedgewick-Rafter cell. Cell densities were recorded until one species dominated the culture for more than 95% of the total biomass. Competition experiments between S. pingue and C. abbreviatum under continuous P limitation were performed at three different dilution rates, i.e. 0.003, 0.007 and 0.020 h-1. Competition between C. abbreviatum and S. chaetoceras under continuous P limitation was followed at D = 0.007 h-1 and D = 0.017 h-1. Two discontinuously P-limited competition experiments with C. abbreviatum and S. chaetoceras were also carried out at D = 0.007 h-1. In one of these experiments phosphate was added in a pulse of 2.5 çmol P per liter of culture suspension two times a week; in the other, 0.7 çmol P per liter of culture suspension was added every day. Pulses were always supplied in the light period. Both pulse regimes effected a total weekly P supply comparable to that in the continuously P-limited competition experiment at that same dilution rate. After 55 days the condition in the culture growing at a small pulse regime was changed to a continous P limitation.
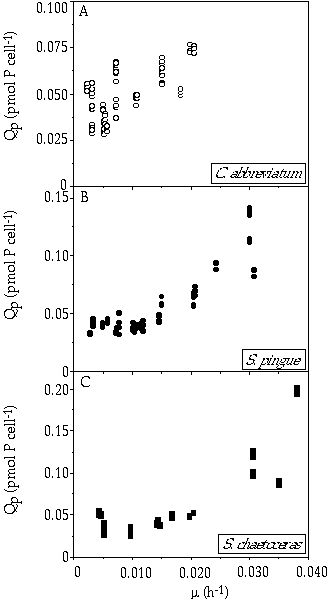
Cellular quota The cellular phosphorus quota for the three species related to the growth rate (Figure 3-1) were fitted to the Droop relation (Equation 3). The model estimated Q0 values of 0.027, 0.030 and 0.026 pmol P cell-1 for C. abbreviatum, S. pingue and S. chaetoceras, respectively. There was no significant difference in growth rate-related cellular P content at growth rates from 0.003 to 0.020 h-1 between the species (P = 0.81). Part of the variance in the data might be explained by the variance in cell volumes of the species. These volumes ranged for S. chaetoceras from 1500 to 4500 çm3, for S. pingue from 2000 to 4000 çm3 and for C. abbreviatum from 2500 to 5500 çm3. All species exhibited the smallest cell size at the lower growth rates. The biomass yield, expressed as mg dry weight çg P-1 decreased for all three species with increasing growth rate (P = -0.6 in all cases, Table 3-I). At all growth rates tested C. abbreviatum produced distinctly more biomass than S. pingue and S. chaetoceras (P < 0.001). Yield values of S. pingue were slightly higher than those of S. chaetoceras (P < 0.001).
Figure 3-1. Cellular P quota (Qp) in relation to growth rate (ç) of A) Cosmarium abbreviatum, B) Staurastrum pingue, and C) Staurastrum chaetoceras.
Table 3-I. Mean yields of C. abbreviatum, S. pingue, and S. chaetoceras at different steady-state growth rates (ç) expressed as mg dry weight per çg cellular phosphorus. Mean yields Ý SD. Number of replicates in parentheses.
ç (h-1) |
Cosmarium abbreviatum | Staurastrum pingue | Staurastrum chaetoceras | |||
| 0.003 | 1.64 Ý 0.41 | (18) | 0.97 Ý 0.20 | (15) | ||
| 0.005 | 1.41 Ý 0.20 | (22) | 0.89 Ý 0.05 | (9) | 0.71 Ý 0.23 | (26) |
| 0.007 | 1.19 Ý 0.17 | (15) | 1.01 Ý 0.10 | (19) | ||
| 0.010 | 1.32 Ý 0.10 | (9) | 0.99 Ý 0.06 | (25) | 0.80 Ý 0.07 | (15) |
| 0.015 | 1.21 Ý 0.08 | (14) | 0.88 Ý 0.20 | (10) | 0.75 Ý 0.07 | (18) |
| 0.020 | 1.09 Ý 0.16 | (13) | 0.70 Ý 0.05 | (15) | 0.66 Ý 0.07 | (12) |
| 0.025 | 0.56 Ý 0.03 | (4) | ||||
| 0.030 | 0.48 Ý 0.04 | (15) | 0.43 Ý 0.06 | (15) | ||
| 0.035 | 0.41 Ý 0.11 | (15) | ||||
P uptake kinetics At all growth rates, the maximum uptake rate (Vi,max) of C. abbreviatum was significantly lower than that of S. pingue or S. chaetoceras (P < 0.001, Table 3-II). There was, however, no significant difference between the maximum uptake rates of S. pingue and S. chaetoceras (P > 0.05). At growth rates up to 0.015 h-1 the affinities for uptake (expressed as the ratio between Vi,max and Km) were higher in C. abbreviatum than in S. pingue and S. chaetoceras (P < 0.05, Table 3-II). Above this growth rate the affinities of the Staurastrum species were higher (P < 0.05). There was no significant difference in affinity between the two Staurastrum species (P = 0.6).
Table 3-II. Maximum uptake rates (Vmax) in çmol P mg protein-1 h-1, half saturation constants (Km) in çmol P L-1 and affinities (Vmax/Km). Mean values Ý SD of C. abbreviatum, S. pingue and S. chaetoceras at different steady-state growth rates (ç). Number of replicates in parentheses.
| ç(h-1) | Vmax | Km | Vmax/Km | n | Vmax | Km | Vmax/Km | n | Vmax | Km | Vmax/Km | n |
| 0.003 | 0.45 Ý 0.10 | 1.54 Ý 0.76 | 0.33 Ý 0.14 | (4) | 1.39 Ý 0.22 | 6.89 Ý 0.97 | 0.21 Ý 0.02 | (3) | ||||
| 0.005 | 0.47 | 1.60 | 0.30 | (1) | 0.81 Ý 0.22 |
4.09 Ý 1.27 | 0.20 Ý 0.05 | (6) | ||||
| 0.007 | 0.34 Ý 0.01 | 1.51 Ý 0.84 | 0.27 Ý 0.14 | (3) | 1.50 Ý 0.31 | 12.58 Ý 3.04 | 0.12 Ý 0.01 | (3) | ||||
| 0.010 | 0.40 Ý 0.11 | 1.29 Ý 0.54 | 0.33 Ý 0.07 | (3) | 1.08 Ý 0.12 | 11.68 Ý 3.49 | 0.10 Ý 0.02 | (3) | 0.91 Ý 0.22 | 6.44 Ý 1.56 | 0.14 Ý 0.02 | (3) |
| 0.015 | 0.27 Ý 0.10 | 1.97 Ý 1.02 | 0.17 Ý 0.12 | (3) | 0.67 Ý 0.03 | 4.05 Ý 0.43 | 0.17 Ý 0.01 | (3) | 0.95 Ý 0.09 | 5.80 Ý 1.08 | 0.17 Ý 0.03 | (4) |
| 0.020 | 0.65 Ý 0.10 | 12.44 Ý 1.76 | 0.05 Ý 0.01 | (3) | 0.83 Ý 0.11 | 4.54 Ý 0.33 | 0.18 Ý 0.03 | (4) | 0.98 Ý 0.21 | 6.95 Ý 2.10 | 0.15 Ý 0.02 | (3) |
| 0.030 | 0.88 Ý 0.05 | 5.78 Ý 1.32 | 0.16 Ý 0.03 | (3) | 0.57 Ý 0.12 | 2.95 Ý 0.72 | 0.20 Ý 0.02 | (3) | ||||
| 0.035 | 0.53 Ý 0.34 | 6.94 Ý 2.61 | 0.07 Ý 0.04 | (3) | ||||||||
P-related growth kinetics The growth rates and Pi concentrations in the culture vessel (calculated using Equations 1 and 2) for the three species were fitted to the Monod model (Equation 3, Figure 3-2). Estimations of çmax were 0.023, 0.042, and 0.043 h-1; and Ks values were 17, 42 and 43 nM P for C. abbreviatum, S. pingue, and S. chaetoceras, respectively. The Monod curves showed an intersection at ç = 0.012 h-1, corresponding with a Pi value of 0.02 çM P (Figure 3-3). Below this intersection point C. abbreviatum can deplete the medium to a greater extent, resulting in a lower Pi concentration, than the two Staurastrum species under these experimental conditions, whereas at higher growth rates just the opposite was the case. There was no observed difference between the two Staurastrum species. The Monod curve of C. abbreviatum intersected the X-axis near zero, whereas those of both Staurastrum species intersected at Pi = 3 nM P (95% confidence interval: 1-6 nM P). Below this concentration growth of Staurastrum was supposed to be impossible. The estimated values of Ks and Pt assume that net uptake of P equals gross uptake- in other words, that there is no substantial cellular leakage of P. From SRP measurements in the culture vessel at ç = 0.007 h-1, no significant difference in possible leakage of P among the three species was observed (data not shown).
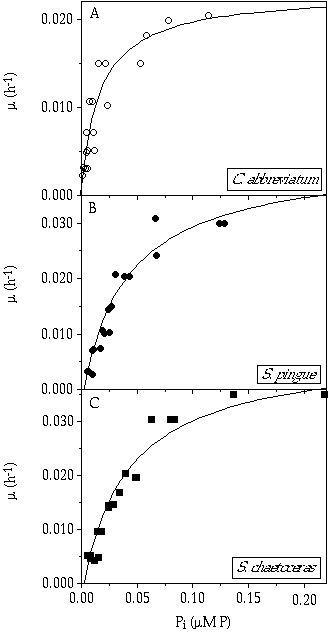
Figure 3-2. Growth rates (ç) in relation to the inorganic phosphorus concentration in the culture vessel (Pi) of A) Cosmarium abbreviatum, B) Staurastrum pingue, and C) Staurastrum chaetoceras. Curves fitted to the Monod model.
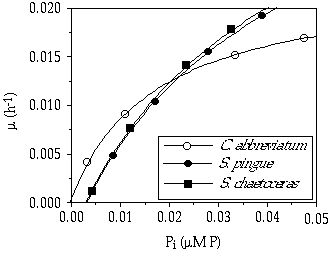
Figure 3-3. Monod curves of the three desmid species as in Figure 3-2 to demonstrate the intersection at Pi = 0.02 çM P.
Competition During the continuous P limitation competition experiments between S. pingue and C. abbreviatum, there was a gradual replacement of Staurastrum by Cosmarium at the dilution rates 0.003 and 0.007 h-1 (Figures 3-4A, B). At D = 0.020 h-1, S. pingue replaced C. abbreviatum within a 50-day period (Figure 3-4C). From these competition experiments, growth rates of C. abbreviatum were related to those of S. pingue resulting in a value greater than 1 at D = 0.003 and 0.007 h-1 and less than 1 at D = 0.020 h-1 (Figure 3-5). The ç of C. abbreviatum relative to the ç of S. pingue at D = 0.003 h-1 was significant higher than this relative growth rate at D = 0.007 h-1 (P < 0.005).
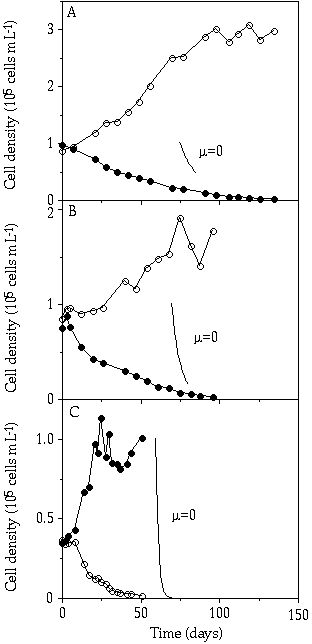
Figure 3-4. Cell concentrations
in mixed continuous-flow cultures of Cosmarium abbreviatum (![]() )
and Staurastrum pingue (
)
and Staurastrum pingue (![]() )
in relation to time at different dilution rates (D). A) D = 0.003 h-1,
B) D = 0.007 h-1,
and C) D = 0.020 h-1.
Slopes (ç = 0) indicate expected decrease rates over a period of 10 days for
non growing organisms.
)
in relation to time at different dilution rates (D). A) D = 0.003 h-1,
B) D = 0.007 h-1,
and C) D = 0.020 h-1.
Slopes (ç = 0) indicate expected decrease rates over a period of 10 days for
non growing organisms.
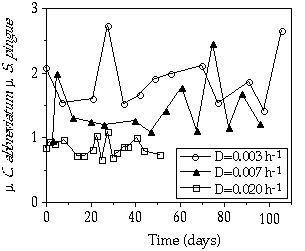
Figure 3-5. Growth rate of Cosmarium abbreviatum relative to that of Staurastrum pingue measured in mixed continuous flow cultures at three different dilution rates.
At D = 0.007 h-1 a competition experiment under a continuous P limitation between C. abbreviatum and S. chaetoceras resulted in the dominance of C. abbreviatum (Figure 3-6). From this experiment (one of our preliminary tests), only relative cell numbers were gathered, but just as in the competition experiment between S. pingue and C. abbreviatum at that same dilution rate (Figure 3-4B), S. chaetoceras was replaced by Cosmarium within 80 days. At D = 0.017 h-1, in contrast, competition between these same two species resulted in a marked predominance of S. chaetoceras within 40 days (Figure 3-7). The mean growth rate of C. abbreviatum relative to that of S. chaetoceras in this experiment was 0.84.
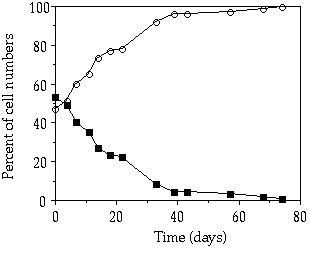
Figure 3-6. Ratio in
cell number between Cosmarium abbreviatum (![]() ) and Staurastrum chaetoceras (
) and Staurastrum chaetoceras (![]() )
in relation to time in a mixed continuous-flow culture at D = 0.007 h-1.
)
in relation to time in a mixed continuous-flow culture at D = 0.007 h-1.
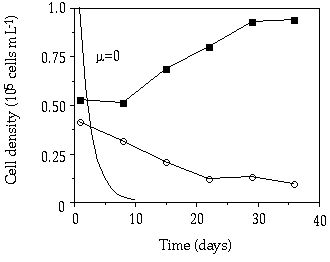
Figure 3-7. Cell concentrations
in mixed continuous-flow cultures of Cosmarium abbreviatum (![]() )
and Staurastrum chaetoceras (
)
and Staurastrum chaetoceras (![]() )
in relation to time at D = 0.017 h-1.
Slope (ç = 0) indicates expected decrease rate over a period of 10 days for
non growing organisms.
)
in relation to time at D = 0.017 h-1.
Slope (ç = 0) indicates expected decrease rate over a period of 10 days for
non growing organisms.
In the pulsed P competition experiment at D = 0.007 h-1, at a relatively big pulse two times a week, S. chaetoceras displaced C. abbreviatum over an 80-day period (Figure 3-8). The mean relative growth rate of C. abbreviatum compared to S. chaetoceras over this period was 0.84. Also in the experiment with a relatively small pulse given every day, S. chaetoceras soon acquired a dominant position (Figure 3-9). However, after 2 weeks a condition was attained in which abundances of S. chaetoceras and C. abbreviatum hardly changed any more. The mean growth rate of C. abbreviatum relative to that of S. chaetoceras over the period from day 13 to day 55 was 0.96, implying almost stable coexistence. After day 55 the culture was brought into a continuous P limitation and within 40 days C. abbreviatum predominated the culture in cell number for 85%.
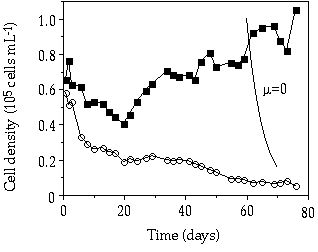
Figure 3-8. Cell concentrations
in mixed continuous-flow culture of Cosmarium abbreviatum (![]() ) and Staurastrum chaetoceras (
) and Staurastrum chaetoceras (![]() ) in relation to time at D = 0.007 h-1,
under a pulsed P addition of 2.5 çmol P per liter of culture two times a week.
Slope (ç = 0) indicates expected decrease rate over a period of 10 days for
non growing organisms.
) in relation to time at D = 0.007 h-1,
under a pulsed P addition of 2.5 çmol P per liter of culture two times a week.
Slope (ç = 0) indicates expected decrease rate over a period of 10 days for
non growing organisms.
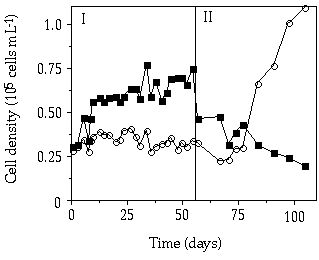
Figure 3-9. Cell concentrations
in mixed continuous-flow culture of Cosmarium abbreviatum (![]() ) and Staurastrum chaetoceras (
) and Staurastrum chaetoceras (![]() ) in relation to time at D = 0.007 h-1
under different P-limited conditions. I) Pulsed P addition of 0.7 çmol P per
liter of culture every day, II) continuous P limitation.
) in relation to time at D = 0.007 h-1
under different P-limited conditions. I) Pulsed P addition of 0.7 çmol P per
liter of culture every day, II) continuous P limitation.
When P uptake and growth kinetics of the three desmid taxa were compared, a striking result was the high degree of similarity between Staurastrum pingue and Staurastrum chaetoceras, both distinctly deviating in their kinetics from Cosmarium abbreviatum. All three Monod relations estimate maximum specific growth rates comparable to the previously determined rates of 0.051, 0.048, and 0.020 h-1 for S. chaetoceras, S. pingue, and C. abbreviatum, respectively (Coesel & Wardenaar 1990). Under conditions of stringent, continuous P limitation, the affinity to P for growth was significantly higher in Cosmarium than in Staurastrum. Under a given condition of stringent continuous P limitation at which Cosmarium has lowered the external P concentration to a certain value, Cosmarium can realize a much higher growth rate relative to those of both Staurastrum species. Cosmarium is thus better adapted to growth in situations with continuously low P concentrations as defined for oligo-mesotrophic lakes. Both Staurastrum species will be outcompeted by Cosmarium under oligotrophic conditions.
This characteristic to acquire P at low P concentrations is caused by the higher affinity to P for uptake of C. abbreviatum compared to both Staurastrum species. Under stringent P limitation, the cell-based P quotas of the three species were comparable. Because Q0 represents the amount of P associated with the structural and metabolic components that are essential to cellular integrity and viability (e.g. cell walls and membranes, DNA, machinery responsible for maintenance metabolism), and the absolute amounts of P increase with increasing cell size (Smith & Kalff 1982), a size dependence for Q0 can be expected (Fuhs 1969, Droop 1974, Goldman 1977). As already stated, cell size of the species studied was about equal. Dry weight-based yields, however, indicate a difference among the species. A difference in mean cellular weight of 2.0, 1.3 and 1.0 ng DW cell-1 for C. abbreviatum, S. pingue, and S. chaetoceras, respectively, could be calculated. Cosmarium abbreviatum has a copious mucilage sheath around the cell, whereas S. pingue and S. chaetoceras do not have such a sheath (Coesel 1994). Because such an extracellular mucous envelope may contain a substantial amount of carbohydrates (e.g. Surek 1983, Smestad & Viera 1994), C. abbreviatum is likely to produce a higher biomass weight per unit of P than the two Staurastrum species. Even the slightly higher biomass yield of S. pingue as compared to S. chaetoceras might be related to this feature because cells of S. pingue showed some mucilage layer whereas cells of S. chaetoceras completely lacked it. The cellular dry weight may thus (partly) reflect the amount of mucous surrounding the cell, which makes C. abbreviatum cells substantially heavier than the cells of both Staurastrum species. The influence of carbohydrate production on cellular weight was also noticed by Kromkamp et al. (1989). Their study showed that Microcystis aeruginosa produced a higher Qp (based on dry weight) at low dilution rates, when compared to Qp expressed per unit of protein. Dry weight may thus suggest more biomass production even though this is not translated into more protein or cells.
The observed species-specific differences in P growth and uptake kinetics fit very well with the origin of the algal strains used because the two Staurastrum species were isolated from an alkaline, eutrophic lake and Cosmarium abbreviatum from a likewise alkaline but oligo-mesotrophic lake. Their P kinetics reflect the 'Ghost of competition past' (Connell 1980, Sommer 1989) when considering P limitation an important factor determining algal dominance in an oligo-mesotrophic lake. The result of the competition experiments between Cosmarium abbreviatum and Staurastrum pingue or Staurastrum chaetoceras can be explained from the species-specific Monod relations. The outcome of our competition experiments agrees with the prediction that the species that can deplete the medium to the lowest concentration should displace all competitors (O'Brien 1974, Tilman 1977). The Monod relation can be interpreted as defined by Tilman et al. (1981), where Pi is replaced by the equivalent symbol R* (residual nutrient concentration) and, thus, the species with the lowest R* for the limiting nutrient wins under continuously P-limited conditions. Where the species with the lowest R* value determines the external Pi concentration, it also determines indirectly the growth rates possible for all other competitors. From Figure 3-3 it can be derived that D = 0.003 h-1 will result in a Pi of 0.003 çM where hardly any growth of S. pingue or S. chaetoceras will be possible, whereas at D = 0.007 h-1, resulting in a Pi-concentration of 0.007 çM, Staurastrum would be able to grow at a relative rate of 0.6 compared to Cosmarium. The competitive advantage of C. abbreviatum compared to S. pingue would thus be greater at D = 0.003 h-1 than at D = 0.007 h-1, which is confirmed by Figure 3-5.
Competition experiments between S. chaetoceras and C. abbreviatum under continuous P limitation at D = 0.007 h-1 and D = 0.017 h-1 showed outcomes comparable to those between S. pingue and Cosmarium at these dilution rates. Mean growth rates of C. abbreviatum at D = 0.007 h-1 were 1.35 and 1.41 relative to those of S. chaetoceras and S. pingue, respectively, and, at D = 0.017 - 0.020 h-1, 0.84 relative to both S. chaetoceras and S. pingue. These results confirm that there were no significant differences between the two Staurastrum species in these competition experiments as could be predicted from their Monod relations. Although it is theoretically possible that the Monod relations, as determined in mono species cultures under continuous illumination are somewhat altered under the light-dark cycle as imposed in the competition experiments (see e.g. Chisholm & Stross 1976a, b), we have no indication of it. P uptake kinetics and P cell quota of suspensions from some competition experiments consisting 95% of one species, were comparable to those from mono species experiments under continuous light (data not shown). The fact that the outcome of competition in our mixed chemostat experiments nicely matched with what was expected from the various species-specific affinities, as determined in single-species cultures, makes any species interference (allelopathic interactions) unlikely. Neither was there any indication of possible differences in cellular P leakage between the two Staurastrum species as observed from the exclusion rates in the various competition experiments.
Literature on competition experiments between algal species related to their nutrient uptake and growth kinetics is scarce and as far as desmids are concerned only the studies of Healey & Hendzel (1988) and Olsen et al. (1989) can be mentioned. Healey & Hendzel (1988) compared Cosmarium subcostatum and Staurastrum paradoxum (originating from the same lake) with regard to uptake and growth kinetics under P limitation. Cosmarium subcostatum appeared to dominate at D = 0.008 h-1, which was ascribed to its greater yield of biomass per unit of P rather than to a higher affinity to P for uptake. Presumably, coexistence of S. paradoxum and C. subcostatum within one and the same lake was enabled by differences in other responses (e.g. vulnerability to predation). Cell volume of S. paradoxum was calculated to be two to three times that of C. subcostatum. The competitive advantage in resource competition of the smaller sized C. subcostatum over the larger sized S. paradoxum, as demonstrated by Healey & Hendzel (1988) agrees with the conclusion by Smith & Kalff (1983) that competition at a wide range of continuous nutrient limitations always favors the smaller alga because superiority in çmax would go hand in hand with a superiority in competitive ability. The untenability of this conclusion was argued by for example, Sommer & Kilham (1985) and also demonstrated in competition experiments with natural plankton by Sommer (1985). Cell size may be a major factor in predicting competition between phytoplankton species for a limiting nutrient, but the importance of variation in uptake parameters among species of comparable size should not be underestimated. Our study unequivocally shows that also within a taxonomically uniform algal group the species with the highest çmax will not per se be superior in competition.
The competition experiments by Olsen et al. (1989) showed that Staurastrum luetkemuelleri with a higher çmax and a higher affinity to P over the whole range of growth rates wins competition under a continuous P limitation but loses to the blue-green Microcystis aeruginosa under markedly pulsed conditions due to the 10 times lower Vi,max of Staurastrum. The prediction that the species with the higher Vi,max wins competition under pulsed conditions (Eppley et al. 1969, Turpin & Harrison 1979, Suttle et al. 1987) is also confirmed in our experiment where the species was given a pulse of 2.5 çM P twice a week. In our experiment where a daily pulse of 0.7 çM P was given, a stable coexistence of the species was established during the last 40 days of the experiment.
Stewart & Levin (1973) theoretically demonstrated that coexistence of species competing for the same resource can occur under pulsed conditions. In addition, Tilman (1982) reasoned that fluctuations in absolute resource level can enable co-existence and thus enhance species diversity. The latter was nicely illustrated by Sommer (1985) with natural phytoplankton assemblages from Lake Constance. Our data indicate that also between the Cosmarium and Staurastrum clones used in our experiments a dynamic equilibrium can be found under a specific, carefully balanced pulse regime.
Appendix: Mean cellular dry weight, protein content and protein:dry weight ratio of C. abbreviatum, S. pingue and S. chaetoceras at different steady-state growth rates. Mean values Ý SD.
| ç (h-1) | ng DW cell-1 | ng protein cell-1 | ratio | ng DW cell-1 | ng protein cell-1 | ratio | ng DW cell-1 | ng protein cell-1 | ratio |
| 0.003 | 2.166 Ý 0.218 | 0.152 Ý 0.050 | 0.070 | 1.172 Ý 0.095 | 0.121 Ý 0.008 | 0.103 | |||
| 0.005 | 1.625 Ý 0.246 | 0.149 Ý 0.014 | 0.092 | 1.150 Ý 0.087 | 0.130 Ý 0.015 | 0.113 | 0.961 Ý 0.206 | 0.117 Ý 0.021 | 0.121 |
| 0.010 | 1.990 Ý 0.151 | 0.138 Ý 0.081 | 0.070 | 1.168 Ý 0.070 | 0.175 Ý 0.013 | 0.150 | 0.766 Ý 0.052 | 0.134 Ý 0.016 | 0.175 |
| 0.015 | 2.304 Ý 0.125 | 0.182 Ý 0.124 | 0.079 | 1.419 Ý 0.135 | 0.186 Ý 0.015 | 0.131 | 0.963 Ý 0.062 | 0.139 Ý 0.008 | 0.144 |
| 0.020 | 2.152 Ý 0.208 | 0.310 Ý 0.020 | 0.144 | 1.437 Ý 0.144 | 0.196 Ý 0.023 | 0.137 | 1.006 Ý 0.075 | 0.145 Ý 0.002 | 0.144 |
| 0.030 | 1.663 Ý 0.298 | 0.222 Ý 0.005 | 0.134 | 1.397 Ý 0.121 | 0.230 Ý 0.035 | 0.165 | |||
| 0.035 | 1.427 Ý 0.177 | 0.242 Ý 0.068 | 0.170 | ||||||