Different response mechanisms of two planktonic
desmid species (Chlorophyceae) to a single, saturating
addition of phosphate
Elly Spijkerman & Peter F.M. Coesel
Abstract
Introduction
Materials and methods
Results
Discussion
Published in the Journal of Phycology.
Two planktonic algal species, Staurastrum chaetoceras (Schr.) G. M. Smith and Cosmarium abbreviatum Rac. var. planctonicum W. & G. S. West, from trophically different alkaline lakes, were compared in their response to a single, saturating addition of phosphate (P) in a P-limited growth situation. Storage abilities were determined using the luxury coefficient R = Qmax/Q0. Maximum cellular P quotas differed depending on whether cells were harvested during exponential growth at µmax (Qmax, R being 26.7 and 9.1 for C. abbreviatum and S. chaetoceras, respectively) or harvested after a saturating pulse at P-limited growth conditions (Q'max, R being 53.5 and 20.2 for C. abbreviatum and S. chaetoceras, respectively). At stringent P-limited conditions, maximum initial uptake rates were higher in S. chaetoceras than in C. abbreviatum (0.094 and 0.072 pmol P cell-1 h-1, respectively), but long-term (net) uptake rates (over c. 20 min) were higher in C. abbreviatum than in S. chaetoceras (0.048 and 0.019 pmol P cell-1 h-1, respectively). Before growth resumed after the onset of a large P addition (150 µM), a lag phase was observed for both species. This period lasted 2-3 days for S. chaetoceras and 3-4 days for C. abbreviatum, corresponding with the time to reach Q'max. Subsequent growth rates (over c. 10 days) were 0.010 h-1 and 0.006 h-1 for S. chaetoceras and C. abbreviatum, respectively, being only 20-30% of maximum growth rates. In conclusion, S. chaetoceras, with a relatively high initial P-uptake rate, short lag phase, and high initial growth rate is well adapted to a P pulse of short duration. Conversely, C. abbreviatum, with a high long-term uptake rate and high storage capacity appears competitively superior when exposed to an infrequent, but lasting pulse. These characteristics provide information about possible strategies of algal species to profit from temporarily high P concentrations
The abilities to take up and to store a limiting nutrient after a pulse are important characteristics of algae living in unstable environments. Many aquatic systems are subjected to considerable periodic nutrient perturbations and theoretical considerations by Grenney et al. (1973) pointed out that the addition of a limiting nutrient can result in changes in species composition in lakes. Shifts in species composition of natural phytoplankton assemblages after nutrient addition were observed by Turpin & Harrison (1979), Scavia et al. (1984), Sommer (1985), and Suttle et al. (1987).
There is a consensus that oligotrophic aquatic habitats generally represent nutrient-limited systems (Maestrini & Bonin 1981). But eutrophic waters also often become nutrient limited in summer (Forsberg & Heyman 1984). In fresh water, the limiting nutrient is typically phosphate (e.g. Kalff & Knoechel 1978). Diel patterns of nutrient uptake, the generation of micro-patches by zooplankton excretion, local pulses by vertebrate faeces, and episodic mixing of the water column are considered to be sources of variability, resulting in periods of temporarily high ambient P concentrations (Lean 1984, Sommer 1989). In shallow, eutrophic lakes frequent resuspension from sediments also may be considered an important P source causing temporarily high nutrient concentrations (Boström et al. 1982).
In phytoplankton, generally two uptake strategies are distinguished (Lean 1984). The smaller-sized species, with a high cellular surface to volume ratio, appear to have a higher affinity for uptake of a limiting nutrient (Laws 1975, Smith & Kalff 1983, Kooijman et al. 1991). Under a continuous, stringent limitation they will outcompete larger-sized species. Larger cells, on the other hand, are believed to take advantage of a sudden increase in nutrient concentration by storing sufficient nutrient to meet metabolic needs for several generations (Turpin & Harrison 1979, Lean 1984, Suttle et al. 1987). Suttle et al. (1987) showed in an experiment with natural phytoplankton that the average cell volume increased with increasing pulse size. Although the outcome of competition in the field will be influenced by other factors besides limiting nutrients alone, cell size is considered a major factor in explaining the composition of phytoplankton communities (Smith & Kalff 1982, Stolte & Riegman 1995). Therefore, when species inhabiting trophically different habitats are compared in their ecophysiological characteristics, such as the ability to benefit from a pulsed addition of a growth limiting nutrient, it is preferable to consider taxa similar in cell size.
We have already shown that under continuously P-limited conditions, Cosmarium abbreviatum, originating from a meso-oligotrophic lake, can realize a higher growth rate than Staurastrum chaetoceras, isolated from a eutrophic lake. These species are taxonomically familiar (Fam. Desmidiaceae), are roughly similar in cell size, and have comparable minimum cellular P quota (chapter 3). Under repetitive pulsed P-limited conditions where P is added in non-saturating concentrations, S. chaetoceras appeared to be competitively superior to C. abbreviatum (chapter 3). With increased pulse dose (and time interval between pulses) the competitive advantage of S. chaetoceras over C. abbreviatum decreased, suggesting that other kinetic features than maximum initial uptake rate might become more important (chapter 5). The aim of the present study was to determine the response of these two trophically different desmid species to a single, saturating addition of P. Phytoplankton responses to nutrient pulses may not be described adequately by means of steady-state growth models (Brown & Harris 1978). Nevertheless, steady-state growth is most intensively studied and its possible application will be considered in the present study, as well.
The experiments were performed with Staurastrum chaetoceras (Schr.) G.M. Smith, clone AO 36, isolated from the alkaline, eutrophic Lake IJmeer (Berger & Sweers 1988) and Cosmarium abbreviatum Rac. var. planctonicum W. & G. S. West, clone AO 116, isolated from the alkaline, oligo- mesotrophic Lake Maarsseveen (I) (Swain et al. 1987). For a description of both lakes, see also chapter 7. Both clones were taken from the desmid collection at the Department of Aquatic Ecology.
Culture conditions and analytical methods— The species were cultured at 20 ± 1 °C in 1 L continuous-flow culture vessels. For details about the continuous-flow device, see Coesel & Wardenaar (1994) and also chapter 1. Modified Woods Hole medium, as described in chapter 2, was used for the continuous cultures, containing 5 µM K2HPO4, 2 mM NaNO3, 150 µM NaHCO3, and 50 µM KCl to avoid a potassium limitation. In the preparation of P-free medium for the batch culture experiments K2HPO4 was left out and the NaHCO3 concentration was raised by a factor 5. The pH was set at 7-7.2. The range of dilution rates (D) tested varied from 0.005 to 0.035 h-1 for Staurastrum chaetoceras and from 0.003 to 0.020 h-1 for Cosmarium abbreviatum. This range in D was determined by the maximum growth rate (µmax) of both species, being 0.046 and 0.022 h-1 in S. chaetoceras and C. abbreviatum, respectively. Circular cool white fluorescent lamps provided an average photosynthetically active radiation (PAR) in the culture vessel of 60-80 µmol m-2 s-1 (Philips TLE 32W/33), which proved to be saturating for growth. Illumination of the unialgal cultures was continuous (24:0 L:D). Cultures were not axenic but bacterial biomass (estimated by acridine staining and counting under a fluorescence microscope) was negligible (<1% of algal biomass). Algal cells were counted with a Coulter Multisizer. Chemostat cultures were considered to be in a steady state (D = µ) when algal biomass varied less than 5% over at least 2 (in case of the lowest dilution rate) to 5 renewals of the culture vessel volume. Samples for particulate phosphorus analysis were centrifuged (1500 g, 10 min), the pellet washed and resuspended in distilled water. After digestion with 56 mM K2S2O8 and 0.15 M H2SO4 at 100 °C for 1h (NEN 1981), soluble reactive phosphorus (SRP) was measured according to Murphy & Riley (1962) on a spectrophotometer. By dividing the particulate P concentration by cell density, cellular P quota (Qp) was obtained. All quotas are expressed on cell basis, but a conversion table can be found in chapter 3. All tests for significance were performed by first applying a Bartlet test for homogeneity of variance and subsequently performing a parametric (ANOVA) or non-parametric (Mann-Whitney U) test, following Sokal & Rohlf (1981). Observed lag phases of growth (t) in the two species were assumed to be related to the single-pulse concentration and to follow the saturation curve:
t = tmax * pulse conc. / (pulse conc. + Kt) (1)
where tmax is the maximum lag period and Kt the half-saturation constant. Differences between these curves were tested comparing the Residual Sum of Squares (RSS) as part of an analysis of covariance, ANCOVA, with the range of single-pulse concentrations being the covariate (Sokal & Rohlf 1981).
All uptake and storage experiments after a single pulse were performed with culture material from steady-state conditions. Samples were diluted two-fold with P-free medium in order to avoid possible light limitation in subsequent batch culture. The diluted cell suspensions of both species were comparable in initial cell density (c. 60. 106 cells L-1) and in total P concentration (c. 2.5 µM; no external P detectable).
Initial uptake experiments— Diluted culture material was subjected to different inorganic phosphorus (Pi) concentrations containing (carrier-free) 32P (Amersham, England) as described in chapter 2. Initial Pi concentrations after addition ranged from 0.5 to 30 µM. Cellular 32P contents were determined on GF/C filters at t = 0, 30, 60 and 300 s, and initial uptake rates (Vi) for every initial Pi concentration were calculated from linear regression, following Riegman & Mur (1984b). By curve fitting to the Michaelis-Menten equation:
Vi = Vi,max * ( Pi / (Km + Pi)) (2)
maximum initial uptake rate (Vi,max) and half-saturation constant for uptake (Km) were computed.
Long-term uptake experiments— Samples of S. chaetoceras and C. abbreviatum were brought into batch culture (continuous light, incident PAR 90-100 µmol m-2 s-1, 20 °C, aeration), incubated for 10-20 min, and subjected to 10 µM P. Every 5 min, samples were taken, put on ice, and centrifuged directly (1500 g, 5 min). Concentration of SRP in the supernatant was measured and net uptake of P was calculated from linear regression (decrease of SRP) over a period of 20-30 min. External P concentrations proved to be saturating over this time period and calculated long-term uptake rates are therefore assumed to be near maximum (Vlt,max, Riegman 1985).
Cellular P quota at µmax (Qmax)— Cells from batch cultures which were periodically diluted with P-saturated culture medium (50 µM P, incident PAR 70-80 µmol m-2 s-1, continuous light, 20 °C) were harvested during exponential growth. These cells, as well as cells from continuous flow cultures growing at µmax under P-saturating conditions (average PAR: 160-230 µmol m-2 s-1, continuous light, 20 °C), were used for measurements of Qmax values.
Cellular P quota after a pulse (Q'max)— Diluted steady-state culture suspensions (µ = 0.005 h-1) of S. chaetoceras and C. abbreviatum were subjected to (unlabelled) K2HPO4 to a final concentration of 1, 5, 10, 50, or 150 µM P. Particulate P and cell density were followed over a 10 day period. During this time the cells were kept in the light (incident PAR 90-100 µmol m-2 s-1) at 20 °C and aerated. When Qp was at its maximum, the quota determined was defined Q'max.
Determination of R and T values— Maximum cellular P quotas (Qmax and Q'max) were compared to minimum cell quotas (Q0, obtained from the Droop relation, see chapter 3) resulting in the cellular storage ability and the growth potential. The storage ability is expressed by the luxury consumption coefficient R defined by Schreurs (1992) as:
R = Qmax / Q0 . (3)
The growth potential T (Pedersen & Borum, 1996), defined as the period over which µmax may be sustained by storage without any external nutrient supply, was provided by:
T = lnR / µmax . (4)
Models— We tried to describe the algal response in the single-pulse experiments (150 µM P) with ecophysiological parameters and the variable internal stores model (Kilham 1978). The model assumes that uptake depends on the external P concentration and follows Michaelis-Menten kinetics (Equation 2). Growth is assumed to be dependent on cellular P quota and to follow the Droop relation (Droop 1974):
µ = µ'max (1 - (Q0 / Qp) ) (5)
where µ'max is the apparent maximal growth rate that would occur if Qp becomes infinite and Q0 is the cellular quota at µ = 0. We compared the use of both initial and long-term uptake rates in Equation 2. In addition, a lag phase in growth had to be incorporated (Nyholm 1978) and for both species this was defined as the time needed to reach Q'max. This criterion was chosen rather an arbitrary one since no clear indication about the length of the lag period could be found beforehand (see Discussion).
Uptake— When maximum initial and long-term uptake rates are compared (Table 4-I), S. chaetoceras had higher initial uptake rates on average, but lower long-term uptake rates than C. abbreviatum (Mann-Whitney U for both uptake rates, P < 0.001). For both C. abbreviatum and S. chaetoceras, the initial uptake rates were found to be significantly higher than long-term uptake rates (ANOVA P < 0.001), but in C. abbreviatum Vlt,max was about 80 - 100 % of Vi,max whereas in S. chaetoceras Vlt,max was only 30 - 40 % of Vi,max.
Table 4-I. Maximum initial (Vi,max) and long-term (Vlt,max) P uptake rates of Cosmarium abbreviatum and Staurastrum chaetoceras (in pmol P cell-1 h-1). Vi,max was measured over a 5 minute period and Vlt,max over a period of 20-30 minutes. Both uptake experiments started with cells from P-limited continuous cultures at different steady state growth rates (µ, h-1). Average ± SD and the number of replicates (n) are given (n.d. = not determined).
|
|
C. abbreviatum |
S. chaetoceras |
||||||
|
µ |
Vi,max |
n |
Vlt,max |
n |
Vi,max |
n |
Vlt,max |
n |
|
0.003 |
0.068 ± 0.016 |
4 |
0.048 ± 0.001 |
6 |
n.d. |
|
n.d. |
|
|
0.005 |
0.072 |
1 |
n.d. |
|
0.094 ± 0.025 |
6 |
0.019 ± 0.009 |
6 |
|
0.007 |
0.080 ± 0.030 |
2 |
n.d. |
|
n.d. |
|
n.d. |
|
|
0.010 |
0.065 ± 0.004 |
3 |
0.048 ± 0.014 |
6 |
0.120 ± 0.015 |
3 |
0.028 ± 0.015 |
4 |
|
0.015 |
0.065 ± 0.015 |
3 |
0.053 ± 0.004 |
6 |
0.132 ± 0.014 |
4 |
n.d. |
|
|
0.020 |
0.202 ± 0.034 |
3 |
n.d. |
|
0.143 ± 0.031 |
3 |
n.d. |
|
|
0.030 |
|
|
|
|
0.129 ± 0.008 |
3 |
n.d. |
|
|
0.035 |
|
|
|
|
0.112 ± 0.060 |
3 |
n.d. |
|
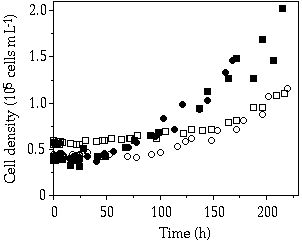
Storage— When cells of C. abbreviatum were subjected to 150 µM P, after 3 - 4 days Q'max was almost twice as large as when subjected to 50 µM, whereas for S. chaetoceras no difference in Q'max was observed at these pulse concentrations (Table 4-II). Another observed difference is the 2-3 times higher Q'max in C. abbreviatum compared to S. chaetoceras (Table 4-II). Under three of the five single-pulse doses, growth in C. abbreviatum started later than in S. chaetoceras. The fit to Equation 1 of the results in Table 4-II resulted in a tmax of 41 and 94 h, Kt of 9 and 28 µM P and corrected R2 of 0.66 and 0.93 for S. chaetoceras and C. abbreviatum respectively. These data are significantly different (ANCOVA, F = 6.89, P < 0.05). The longer time lag in C. abbreviatum is well visualized in the 150 µM P perturbation experiment where cell density in C. abbreviatum remains constant over a longer period than in S. chaetoceras before an increase in cell density can be detected (Figure 4-1). The growth rate of S. chaetoceras after the P addition always exceeded that of C. abbreviatum (Mann-Whitney U, P < 0.05; Table 4-II). When growth of S. chaetoceras started in the 150 µM P perturbation experiment, the cells apparently took up P at the same rate as needed for growth (compare Figures 4-1 and 4-2), resulting in a constant Qp (= Q'max) until the end of the experiment (Figure 4-3). C. abbreviatum cells took up P until c. 75 h after the start of the experiment (determination of Q'max, Figures 4-2 and 4-3), then cell division started (Figure 4-1) and P uptake stopped (Figure 4-2) resulting in a decrease of Qp with growth at the same rate (Figures 4-1 and 4-3). The Q'max values found for both species (Table 4-II) were about twice as high as the P quota values measured at µmax (Qmax, Table 4-III).
Table 4-II. Maximum obtained internal P quota (Q'max, pmol P cell-1), subsequent growth rates (µ, h-1), and lag period in growth (t, h) after different additions of P (µM) to batch cultures of Cosmarium abbreviatum and Staurastrum chaetoceras originating from P-limited continuous cultures growing at µ = 0.005 h-1 (Qp at steady state being 0.039 and 0.044 pmol cell-1 for C. abbreviatum and S. chaetoceras, respectively). The highest two single-pulse experiments were done in duplicate.
|
|
C. abbreviatum |
S. chaetoceras |
||||
|
Pulse conc. |
Q'max |
µ |
t |
Q'max |
µ |
t |
|
150 |
1.36 / 1.53 |
0.004 / 0.007 |
66 / 87 |
0.52 / 0.53 |
0.008 / 0.010 |
33 / 44 |
|
50 |
0.80 / 0.80 |
0.009 / 0.011 |
64 / 70 |
0.58 / 0.57 |
0.011 / 0.012 |
21 / 51 |
|
10 |
0.16 |
0.009 |
14 |
0.22 |
0.013 |
16 |
|
5 |
0.10 |
0.005 |
14 |
0.13 |
0.012 |
20 |
|
1 |
0.06 |
0.003 |
8 |
0.07 |
0.008 |
3 |
Figure 4-1. Cell densities in batch cultures of Cosmarium
abbreviatum, (![]() and
and ![]() ,
representing duplicate experiments) and Staurastrum chaetoceras (
,
representing duplicate experiments) and Staurastrum chaetoceras (![]() and
and ![]() , representing duplicate experiments)
originating from steady-state P-limited continuous cultures, after a saturating
P addition (150 µM) in relation to time.
, representing duplicate experiments)
originating from steady-state P-limited continuous cultures, after a saturating
P addition (150 µM) in relation to time.
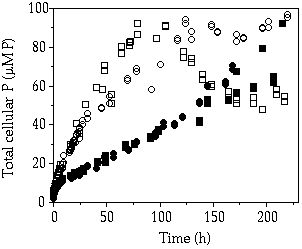
Figure 4-2. Total cellular P concentrations in batch cultures
of Cosmarium abbreviatum, (![]() and
and ![]() , representing duplicate experiments)
and Staurastrum chaetoceras (
, representing duplicate experiments)
and Staurastrum chaetoceras (![]() and
and ![]() , representing duplicate experiments)
originating from steady-state P-limited continuous cultures, after a saturating
P addition (150 µM) in relation to time.
, representing duplicate experiments)
originating from steady-state P-limited continuous cultures, after a saturating
P addition (150 µM) in relation to time.
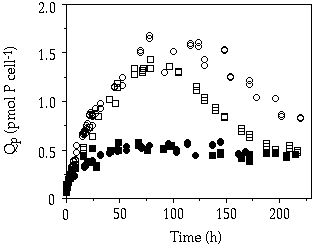
Figure 4-3. Cellular P quota in batch cultures of Cosmarium
abbreviatum, (![]() and
and ![]() ,
representing duplicate experiments) and Staurastrum chaetoceras (
,
representing duplicate experiments) and Staurastrum chaetoceras (![]() and
and ![]() , representing duplicate experiments)
originating from steady-state P-limited continuous cultures, after a saturating
P addition (150 µM) in relation to time.
, representing duplicate experiments)
originating from steady-state P-limited continuous cultures, after a saturating
P addition (150 µM) in relation to time.
The Qmax values measured in batch culture show a relatively high variance (Table 4-III). Data from batch cultures may be influenced by the presence of senescent or dead cells (Cembella et al. 1985) and growth rates, although exponential, often are not equal to µmax as measured in continuous-flow culture. Moreover, in batch culture, a certain range of Qmax values at which cells grow at µmax could be expected. Average values were roughly comparable with those from continuous-flow culture. For R and T calculations the mean values from both batch and continuous culture experiments were used because the data in continuous culture were only obtained once. In C. abbreviatum, both P storage ability and resulting growth potential were distinctly higher than in S. chaetoceras (Table 4-III). The R values calculated for the data obtained from the large single-pulse experiment (Table 4-II) were 53.5 and 20.2 for C. abbreviatum and S. chaetoceras, respectively and T was 7.5 and 2.7 days. When Q'max is not divided by the theoretical Q0 value, but by the actual Qp value measured in the algae before P concentration is enhanced, an ecologically relevant storage ability (R) is computed (see Discussion for further detail). In the latter case, R values are calculated as 32.8 and 12.8, and T values as 6.6 and 2.3 for C. abbreviatum and S. chaetoceras, respectively.
Table 4-III. Internal P content (pmol P cell-1) of Cosmarium abbreviatum and Staurastrum chaetoceras growing exponentially in P-saturated batch culture (Qmax-bc), at µmax in continuous culture (Qmax-cc) and at µ = 0 calculated with the Droop relation (Q0). For Qmax, average ± SD and, in parentheses, the number of replicates are given (* referring to replicate measurements on the same culture sample). From these data and µmax (obtained in continuous culture, being 0.53 and 1.10 d-1 for C. abbreviatum and S. chaetoceras, respectively) storage ability R (Qmax-cc/Q0) and growth potential T (Ln R/µmax, d) were calculated.
|
|
Qmax-bc |
Qmax-cc |
Q0 |
R |
T |
|
C. abbreviatum |
0.565 ± 0.160 (6) |
0.878 ± 0.009 (4*) |
0.027 |
26.7 |
6.2 |
|
S. chaetoceras |
0.238 ± 0.023 (6) |
0.234 ± 0.004 (4*) |
0.026 |
9.1 |
2.0 |
Modelling— The variable internal stores model did not describe the data from the large single-pulse experiment accurately when initial uptake rates were used and cells were expected to grow at µmax when Qp reaches Q'max values following Droop's relation (not shown). According to this model cells start to grow at µmax soon after the pulse and exhaust the P-pool very quickly. The predicted production of new cells then greatly overestimates the cell production measured (not shown). A more reliable description was obtained when long-term uptake rates were used with measured growth rates, instead of those resulting from Droop's model (Figure 4-4). Cell production is also much better described with this variant model (Figure 4-5). In both S. chaetoceras and C. abbreviatum the Q'max is reached earlier in the model than in the actual situation and cell production is somewhat overestimated. The evolution of cellular P in the experiment with S. chaetoceras was accurately described by the model. With respect to C. abbreviatum, in the model the external P-pool was exhausted after 170 hours, initiating a decrease in Qp with growth (Figure 4-4). The decrease in Qp with growth measured in the experiment was not due to exhaustion of the medium however. In the experiment external P appeared to be still available after 170 hours but uptake by C. abbreviatum ceased and growth resumed.
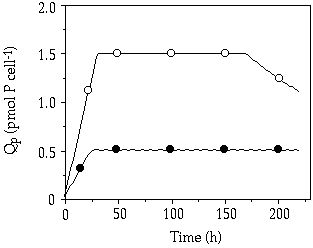
Figure 4-4. Evolution of cellular P quota in C.
abbreviatum (--![]() --) and S.
chaetoceras (--
--) and S.
chaetoceras (--![]() --) after addition
of a saturating P addition (150 µM) as predicted by a modified variable internal
stores model, using Vlt,max, Q'max
and actual growth rates (more details in text). Compare with patterns in Figure
4-3 to see how predicted data match measured data.
--) after addition
of a saturating P addition (150 µM) as predicted by a modified variable internal
stores model, using Vlt,max, Q'max
and actual growth rates (more details in text). Compare with patterns in Figure
4-3 to see how predicted data match measured data.
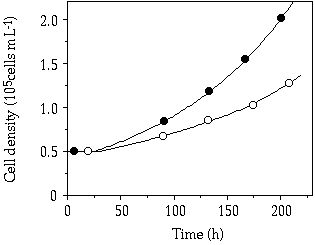
Figure 4-5. Evolution of cell density in C. abbreviatum
(--![]() --) and S. chaetoceras
(--
--) and S. chaetoceras
(--![]() --) after addition of a saturating
P addition (150 µM) as predicted by the modified variable internal stores model.
Compare with patterns in Figure 4-1 to see how predicted data match measured
data.
--) after addition of a saturating
P addition (150 µM) as predicted by the modified variable internal stores model.
Compare with patterns in Figure 4-1 to see how predicted data match measured
data.
Parameters considered to be relevant in predicting the algal response to a pulsed addition of a limiting nutrient are uptake rate, storage ability, and maximum growth rate. Although the maximum initial uptake rate is a major characteristic for storage (Eppley et al. 1969, Turpin & Harrison 1979), the duration over which elevated uptake rates are maintained during a P pulse is also important in competition (Suttle & Harrison 1986, Suttle et al. 1987, Kromkamp et al. 1989). Initial uptake rates in S. chaetoceras were higher than in C. abbreviatum, indicating an advantage to S. chaetoceras over C. abbreviatum when a pulse is of short duration. When, on the other hand, maximum uptake occurs over a prolonged period, the species with the higher long-term uptake rate, C. abbreviatum, is favoured over S. chaetoceras. Lehman & Sandgren (1982) found that smaller cells have a higher Vi,max than larger cells (also shown by Smith & Kalff 1982) but can only sustain increased uptake rates over a short period of time. Uptake rate in the 60-90 min interval was only 30% of that in the 0-5 min period (see also Suttle et al. 1988). A comparable ratio between initial and long-term uptake rates as described by Suttle et al. (1988) was found in our experiments for S. chaetoceras. However, Vlt,max in C. abbreviatum, was only slightly lower than Vi,max. These results suggest that a feedback mechanism of Qp on maximum uptake rates is more effective in S. chaetoceras than in C. abbreviatum (see also chapter 8). Both initial and long-term uptake rates are important for algae to benefit from pulses under nutrient-limited conditions: Vi,max to profit by short pulses and Vlt,max to benefit from long ones.
The storage ability of C. abbreviatum was found to be much higher than that of S. chaetoceras, whether it was expressed as Qmax/Q0, Q'max/Q0 or Q'max/Qp. Unfortunately, comparisons with values in the literature are difficult because the definition of storage is used ambiguously. Storage was first defined by Droop (1974, 1975) as the luxury coefficient R = K'Q/KQ, where K'Q is the apparent cell quota of a non-limiting nutrient and KQ the subsistence quota of a limiting nutrient (= Q0). This ratio was later used by Tilman & Kilham (1976) and Brown & Button (1979). They measured cellular P quota in nitrogen-limited batch cultures (K'Q) and in the early stationary phase of P-limited batch cultures (KQ, µ = 0). Using this method, Tilman & Kilham (1976) found R (for P) to be 82 and 6.6 for Asterionella formosa and Cyclotella meneghiniana, respectively. Brown & Button (1979) found an R of 56.5 for Selenastrum capricornutum and Lang & Brown (1981) calculated R = 71 and R = 10 for Synechococcus sp. and Scenedesmus quadricauda, respectively. The R values of C. abbreviatum and S. chaetoceras are in the same range, despite the differences in method used. Droop's ratio uses two cellular quotas originating from totally different growth situations, which gives an indication about storage ability but presumably lacks ecological relevance. Elrifi & Turpin (1985) found an increased Qp under nitrate-limited conditions as compared to the one found under maximum-growth conditions, so Qp may change under growth limitation by another resource. K'Q values cannot truly predict what happens with the Qp of the cells when exposed to a pulsed situation but, nevertheless, are commonly used to indicate storage capacity. Ecologically more relevant is a ratio for storage capacity R = Q'max/Qp expressing the maximum amount of P (Q'max) accumulated in cells from stringent P-limited conditions (containing the minimum Qp values observed) after a saturating pulse. Our study gives some insight in differences in storage capacity dependent on its definition.
The internal cellular P concentrations were approximately two-fold greater under transient conditions (Table 4-II, Q'max) than maxima observed under growth at µmax (Table 4-III, Qmax), differing by a factor of c. 2 for both C. abbreviatum and S. chaetoceras. A likewise, though shorter lasting overshoot mechanism, is known for other algal species (Fuhs et al. 1972, Rhee 1973, Lang & Brown 1981). Rather than storage capacity itself, potential cell production based on nutrients stored is an important parameter in competition. We therefore used the growth potential T (Pedersen & Borum 1996) to describe the storage capacity in the two desmids. Application of this parameter indicates that C. abbreviatum is able to grow at µmax for 6.6 days on the internal P pool obtained during a temporarily high ambient P concentration. This is in contrast to S. chaetoceras where µmax on the stored P-pool is only sustained for 2.3 days. The growth potential (T) of C. abbreviatum is relatively high in comparison to those derived from Lang & Brown (1981): i.e. 4.3 days for Synechococcus sp. and 1.2 days for Scenedesmus quadricauda. A combination of a high storage ability and low µmax as found in our study for C. abbreviatum was reported earlier (Braddock & Brown 1994, Lang & Brown 1981). However, it was not supported by Tilman & Kilham (1976) and Kromkamp et al. (1989), who found a large difference in storage ability for species with comparable µmax.
A rapid increase in P quota of P-limited cells after a pulse does not result in immediate cell division events (Azad & Borchardt 1970, Rhee 1973, 1974) because major metabolic shifts are required first (Healey 1979). In our saturating P addition experiment (150 µM), a distinct difference in lag period was found between S. chaetoceras and C. abbreviatum, i.e. almost 4 days in C. abbreviatum versus less than 2 days in S. chaetoceras. This is long compared to a lag phase of 0-24 h observed after a large P addition to P-starved continuous cultures of Chlorella pyrenoidosa (Nyholm 1978). In P-starved batch cultures, growth of Scenedesmus quadricauda started 15 to 20 h after a P addition (Healey 1979). Time lags lasting 2-3 days after a large P pulse have incidentally been reported for other algae (Rhee 1980, Collos 1986). Burmaster (1979) suggested a constant time delay in growth after a perturbed situation, whereas Azad & Borchardt (1970) related the length of the lag period to the degree of P starvation. Also Cembella et al. (1985) stated that the time lag before recoupling of uptake and growth is a function of the degree of nutrient limitation. However, in our experiment, the longer lag time in C. abbreviatum as compared to S. chaetoceras cannot be related to a higher degree of P limitation. Both species had comparable Qp values in the preceding growth phase (chemostat at D = 0.005 h-1). Since, under those preceding culture conditions, growth rate of C. abbreviatum was 23 % of its µmax, whereas that of S. chaetoceras was only 11 % of its µmax, rather the opposite may be supposed, i.e. that C. abbreviatum was less severely limited than S. chaetoceras. The lag phase observed in our experiments appears to correspond with the time taken by the organism to obtain external P and reach Q'max. When not enough P was supplied to the cells to reach Q'max, growth started when the external P pool was depleted. Although it is possible that the end of the lag period in growth is determined by parameters other than external P concentration or Q'max, there was no indication of that, as uptake period always corresponded with lag period. Increased time lag in growth with pulse dose comparable to our findings was found before (Collos 1986). In algal competition models the importance of a lag period is often underestimated. From our experiment it is obvious that lag time should be added to the list of parameters relevant in predicting the algal response to a pulsed addition of a limiting nutrient.
In both S. chaetoceras and C. abbreviatum, the growth rate realized after the saturating P addition did not reach µmax, as could be expected according to the Droop model, but equalled only 20 to 30% of it. In both species growth rates after the highest pulse were lower than those after a smaller pulse, suggesting inhibited growth caused by a P shock (Nyholm 1978). This effect was less visible in S. chaetoceras, suggesting that this species is less sensitive to such a P shock than C. abbreviatum.
Kilham's (1978) variable internal stores model proved to be unsuitable in predicting the reaction of our test species to a single, saturating P addition. Information obtained from the perturbation experiment itself had to be used for an appropriate description of cell evolution and internal P quota. The variable internal stores model does not include feedback inhibition of uptake by increased internal P quota. This was taken into account in the models developed by Morel (1987) and used by Grover (1991b). However, these more advanced models do not fit either, because in C. abbreviatum Vi,max does not vary with Qp and in S. chaetoceras only a rather weak correlation can be obtained (chapter 8). The uptake response of these two desmid species to a saturating perturbation was both unpredictable and mutually distinctly different. At this moment it is therefore hard to give concrete suggestions for further improvements of the model. We can only endorse the statement of Brown & Harris (1978) and Braddock & Brown (1994) that the response of an algal species to a large P pulse cannot be predicted from steady-state growth parameters.
The results obtained in our present study suggest that, of the two desmid species compared, Staurastrum chaetoceras will be better adapted to an environment that is frequently subjected to short P pulses (higher maximum initial uptake rates, faster shift from uptake to growth, and a higher maximum growth rate). When pulse duration and intervals between pulses become longer, the characteristics of Cosmarium abbreviatum (higher maximum long-term uptake rates, higher storage ability, and lower maximum growth rate, resulting in a higher growth potential) fit better than those of S. chaetoceras. Unfortunately, the species-specific physiological differences described above cannot readily be interpreted as different survival strategies, because insufficient knowledge is present about frequency, height, and duration of nutrient pulses in oligotrophic versus eutrophic systems (e.g. Harris 1986). Boström et al. (1982) concluded from several studies that repeated resuspension of sediments in shallow eutrophic lakes may be an important P source causing temporarily high nutrient concentrations. In deep, oligotrophic lakes however, incidental, large nutrient pulses may occur after storm events (Marra et al. 1990, Aoki et al. 1996) and by internal seiches (Kersting 1981). As P pulses are probably less rapidly consumed in oligotrophic than in eutrophic systems because of a much lower concentration of primary producers, those pulses might persist over a prolonged period.
In phytoplankters, parameters like maximum uptake rate and storage capacity are conventionally related to cell size. In general, smaller cells, due to their relatively large surface area: volume ratios have higher maximum uptake rates (Lehman & Sandgren 1982, Smith & Kalff 1982), whereas bigger cells, characterized by relatively large vacuoles, have higher storage capacities (Suttle et al. 1987, Stolte & Riegman 1996). In the present paper we have demonstrated that the combinations high Vi,max-low R and low Vi,max-high R occur also among algal species with comparable cell size, but differing in trophic state of their habitat. We therefore hypothesize that these combinations of ecophysiological characteristics represent different survival strategies, rather than being a mere consequence of cellular surface area to volume ratio. Extension of the trade-off between high Vi,max and high R as evaluated by Grover (1991a) then leads to a more ecologically relevant approach. If the lag period t is also considered, responses to a nutrient pulse can be interpreted as a trade-off between a quick start of cell division connected to a short period of fast reproduction and a postponed growth start followed by a prolonged period of steady reproduction. Our hypothesis might be tested by comparing natural phytoplankton samples from trophically different lakes with regard to storage capacitity.