Growth kinetic parameters of two planktonic desmid
species under fluctuating phosphorus conditions
in continuous-flow culture
Elly Spijkerman & Peter F.M. Coesel
Abstract
Introduction
Materials and methods
Results
Discussion
Published in the Journal of Plankton Research
Two planktonic desmid taxa Staurastrum chaetoceras and Cosmarium abbreviatum var. planctonicum, were examined under pulsed phosphorus (P)-limited conditions in continuous culture. Two pulse regimes were applied, i.e. 2.5 µM P twice a week, and 10 µM P once every two weeks. Under both pulse regimes S. chaetoceras showed a higher maximum P uptake rate (Vi,max) and affinity for P uptake (Vi,max/affinity constant Km) than C. abbreviatum. Affinity for P uptake in S. chaetoceras just before pulsing was higher than shortly after pulsing, where C. abbreviatum did not show any significant difference. Cell densities and cellular P quota in S. chaetoceras and C. abbreviatum fluctuated in a comparable way, but fluctuations in C. abbreviatum were less pronounced than in S. chaetoceras. Mean cell volume of both species was greater under the bimonthly than under the biweekly pulse regime, and the lowest under continuous P limited conditions. Competition between S. chaetoceras and C. abbreviatum under the bimonthly pulse regime was won by S. chaetoceras, but displacement was less fast than under more frequent pulsing (equalling the same total P supply). The above-mentioned results are discussed in relation to possible ecological strategies.
Algal cells living in an unstable environment are continuously subjected to a fluctuating nutrient supply. Periods of superfluous availability of a growth limiting nutrient may be interspersed with periods of shortage (e.g. Sommer 1991a,b). Although we are convinced of the causal relationship between fluctuating nutrient concentrations and algal population dynamics in the field, this is hardly reflected in relevant experimental research. When predicting the growth of one or more species during fluctuating nutrient supply, often physiological data from growth in steady-state continuous nutrient-limited conditions are used (Olsen et al. 1989, Grover 1988, 1991b) ignoring any physiological changes resulting from the pulsed supply regime.
In order to study possible adaptation in phosphorus (P) uptake kinetics and growth response, we cultured two desmid species under two different, fluctuating P regimes. The two desmid species, Staurastrum chaetoceras and Cosmarium abbreviatum, originated from trophically different alkaline lakes and have been well characterized in their growth kinetic parameters under continuous P limitation (chapter 3).
Under continuous P limitation we found S. chaetoceras to have a higher maximum initial uptake rate (Vi,max) and C. abbreviatum to have a higher affinity for uptake, i.e. Vi,max/affinity constant Km (chapter 3). Because the internal P quotas were comparable between the two species under these conditions, the difference found in uptake kinetics led to a higher affinity for growth of C. abbreviatum under stringent P limitation (µ < 0.012 h-1), compared to S. chaetoceras. Under less stringent P limitation (µ > 0.012 h-1) S. chaetoceras had the higher affinity for growth and these results were in agreement with the outcome of competition between these two species under different conditions of continuous P limitation (chapter 3). Besides this, we found maximum uptake rates measured over a longer time period (20 min) in cells grown under continuous P limitation to be higher in C. abbreviatum than in S. chaetoceras (chapter 4). This characteristic is of importance when algal cells are subjected to a saturating pulse. The present paper deals with intermediate conditions between continuous P limitation and a saturating pulse.
The experiments were performed with Staurastrum chaetoceras (Schr.) G.M. Smith, clone AO 36, isolated from the alkaline eutrophic Lake IJmeer (Berger & Sweers 1988) and Cosmarium abbreviatum Rac. var. planctonicum W. & G. S. West, clone AO 116, isolated from the alkaline, oligomesotrophic Lake Maarsseveen (I) (Swain et al. 1987), both lakes being located in The Netherlands. See, for a description of both lakes, also Table 7-I (chapter 7). Clones were taken from the desmid collection at our department.
Culture conditions and analytical methods— The species were cultured at 20 ± 1 °C in 1 L continuous flow culture vessels. For details about the continuous flow device, see Coesel & Wardenaar (1994) and chapter 1. Circular fluorescent tubes provided an average photosynthetically active radiation (PAR) in the culture vessel of 140-200 µmol m-2 s-1, which proved to be saturating for growth. Illumination of the unialgal cultures was continuous. The inflow medium contained no P, but did contain 36 µM Fe (added as Fe-EDTA-complex). Other nutrients were added as described in chapter 2. N:P ratio (by atoms) was always > 800 or > 200 during the 2.5 or 10 µM P pulse regime, respectively. The dilution rate (D) was set at 0.007 h-1 for every culture condition described and P was added directly in the culture vessel from a sterilized stock solution. Two pulse regimes were applied: 2.5 µM P twice a week and 10 µM P once every two weeks, resulting in a total weekly P supply comparable to that in continuously P-limited cultures at the same dilution rate (5 µM P). Cultures were not axenic but bacterial biomass (estimated by acridine staining and counting under a fluorescence microscope) was negligible (<1% of algal biomass). Algal cells were counted and cell volumes estimated with a Coulter Multisizer. From every culture condition cell volumes of at least 50 individuals of each species were measured microscopically by use of appropriate geometric formulae. As to C. abbreviatum, the cell suspension was coloured with indian ink highlighting the extracellular mucous layer; the thickness of this layer (at the apex) was measured separately. Growth rates were calculated over different time intervals during the pulse regime. In the 2.5 µM P pulse regime two intervals (day 0-2 and 2-31/2) and in the 10 µM P pulse experiment five intervals (day 0-2, 2-4, 4-7, 7-9 and 9-14) were distinguished in which growth was calculated. After the addition of a pulse, a time delay was often observed before growth resumed. These delays were estimated by fitting an exponential curve on the decrease as well as one on the increase of cell density. The period from the pulse to the intercept was taken as the time delay. Protein was measured according to Lowry et al. (1951). Cellular P concentrations were determined in the pellet after centrifugation (1500 g, 10 min); total cellular P was measured after digestion with K2S2O8 (added in excess) and 0.15 M H2SO4 in sealed glass tubes at 100 °C for 1h. The external soluble reactive phosphorus (SRP) was assessed from the supernatant after centrifugation (1500 g, 10 min). Both fractions were measured according to Murphy & Riley (1962). By dividing total cellular P concentration by cell density, cellular P quota (Qp) were obtained. Tests for significance were done following Sokal & Rohlf (1981).
Uptake experiments— Uptake experiments were performed with single-species culture material, just before and 24 h after the addition of a pulse. In the case of the 2.5 µM P pulse, uptake experiments were also performed 1 h after the pulse because the pulse was just consumed at this time comparable to the 24 h after the 10 µM P pulse. Culture material was 2-fold diluted with P-free culture medium and pulsed with different inorganic phosphorus (Pi) concentrations containing 32P as described in chapter 2. Initial Pi concentrations ranged from 0.5 to 30 µM. Cellular 32P contents were determined at t = 0, 30, 60 and 300 s, and initialuptake rates (V) for every initial Pi concentration were calculated from a linear regression, following Riegman & Mur (1984b). By curve fitting to the Michaelis-Menten equation
V = Vi,max * ( Pi / (Km + Pi)) (1)
maximum uptake rate (Vi,max) and half-saturation constant for uptake (Km) were computed.
Competition experiment— A discontinuously P-limited competition experiment with C. abbreviatum and S. chaetoceras was carried out at D = 0.007 h-1. P (10 µM) was added once every 2 weeks, comparable to the single-species culture. To resemble natural conditions more closely, illumination in the competition experiment was applied under a 16:8 h light:dark regime. Pulses were always supplied during the light period. Other growth conditions were as described for single-species chemostat cultures. Algal strains were pre-cultured in chemostats under the target P limitation. Experiments were then started by mixing the two species in a 1:1 cell number ratio. Cell numbers were counted three times a week using a 1 ml capacity Sedgewick-Rafter cell. The rate at which one species was replaced by the other was estimated by fitting an exponential curve on the relative decrease of one of the species over time. This replacement rate was compared with those derived from previous competition experiments carried out under other conditions of P limitation (chapter 3).
P uptake kinetics in single-species cultures— Both with the 2.5 and 10 µM P pulse regime, maximum initial uptake rates (Vi,max) and affinities (Vi,max/Km) were significantly higher in S. chaetoceras than in C. abbreviatum (Table 5-I, ANOVA, P < 0.001). In C. abbreviatum the affinity constant (Km) before and after each pulse was about the same (ANOVA, P = 0.965), but in S. chaetoceras after each pulse, when the external Pi concentration was just exhausted, Km was higher compared to before (Mann-Whitney U, P < 0.05). This resulted in a lower affinity for S. chaetoceras after the pulse than before. When P was exhausted for a longer period (24 h after the 2.5 µM P pulse), the affinity constant was comparable to the initial values again (ANOVA, P = 0.759).
Table 5-I. Maximum initial uptake rates (Vmax, µmol P mg Prot-1 h-1), affinity constants (Km, µmol P L-1) and affinities (Vmax/Km) for C. abbreviatum and S. chaetoceras before and after pulses of 2.5 and 10 µM P. Means ± SD, n = number of replicates.
|
|
C. abbreviatum |
S. chaetoceras |
||||||
|
2.5 µM P pulse |
Vmax |
Km |
Vmax/Km |
n |
Vmax |
Km |
Vmax/Km |
n |
|
Before |
0.68 ± 0.21 |
6.61 ± 1.99 |
0.10 ± 0.00 |
2 |
0.97 ± 0.20 |
3.10 ± 0.29 |
0.32 ± 0.09 |
2 |
|
After 1 h |
0.66 ± 0.38 |
7.74 ± 1.63 |
0.08 ± 0.03 |
2 |
1.32 |
7.64 |
0.17 |
1 |
|
After 24 h |
0.59 ± 0.10 |
6.31 ± 0.15 |
0.09 ± 0.01 |
2 |
1.02 ± 0.01 |
3.19 ± 0.77 |
0.33 ± 0.08 |
2 |
|
10 µM P pulse |
|
|
|
|
|
|
|
|
|
Before |
0.59 ± 0.19 |
6.29 ± 3.63 |
0.10 ± 0.03 |
3 |
1.39 ± 0.38 |
3.57 ± 0.42 |
0.40 ± 0.15 |
2 |
|
After 24 h |
0.46 ± 0.31 |
5.03 ± 1.53 |
0.09 ± 0.04 |
2 |
0.99 ± 0.20 |
6.06 ± 2.55 |
0.17 ± 0.04 |
2 |
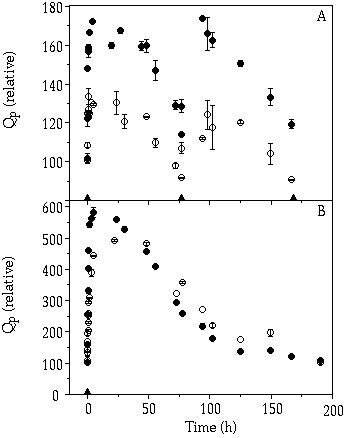
Course of Qp in single-species cultures— To standardize the data, Qp at the time of the pulse was set to 100% for both species (Figure 5-1A & B). After a pulse was given the external P was taken up very quickly by S. chaetoceras and C. abbreviatum, partly filling their internal stores. In the 2.5 µM P pulse regime S. chaetoceras could reach a higher Qp than C. abbreviatum (Figure 5-1A), because the culture contained a somewhat lower cell density compared to the culture of C. abbreviatum (Figure 5-2A). When the data were corrected for this difference in pulse size per cell, no differences in Qp between S. chaetoceras and C. abbreviatum could be observed. In the 10 µM P pulse experiment, C. abbreviatum attained its maximum Qp later than S. chaetoceras (Figure 5-1B).
Figure 5-1. Evolution of cellular P quota (Qp)
relative to Qp at time 0 ( = 100%) of
Cosmarium abbreviatum (![]() )
and Staurastrum chaetoceras (
)
and Staurastrum chaetoceras (![]() ) in the pulsed P-limited monocultures. P pulses are indicated by triangles
on the abscissa: (A) 2.5 µM P pulse; (B) 10 µM P pulse.
) in the pulsed P-limited monocultures. P pulses are indicated by triangles
on the abscissa: (A) 2.5 µM P pulse; (B) 10 µM P pulse.
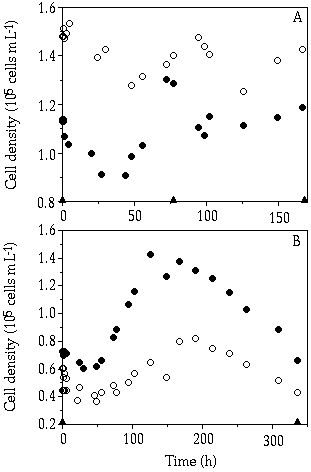
Figure 5-2. The course of cell density of Cosmarium abbreviatum
(![]() ) and Staurastrum chaetoceras
(
) and Staurastrum chaetoceras
(![]() ) during the monoculture experiments.
P pulses are indicated by triangles on the abscissa: (A) 2.5 µM P pulse; (B)
10 µM P pulse.
) during the monoculture experiments.
P pulses are indicated by triangles on the abscissa: (A) 2.5 µM P pulse; (B)
10 µM P pulse.
Course of cell density in single-species cultures— Considering the fluctuating cell density in the pulsed cultures, differences between C. abbreviatum and S. chaetoceras can be observed (Figures 5-2 & 5-3). In the 2.5 µM P pulse experiment, fluctuations in the cell density of both species seemed to be independent of the pulse regime (Figure 5-3A). When calculating growth rates on the basis of cell numbers for the different time intervals (Table 5-II), it is shown that in the period following the pulse (day 0-2) C. abbreviatum realized a significant higher growth rate than S. chaetoceras (ANOVA, P < 0.001), whereas S. chaetoceras had a higher growth rate in the period of day 2-31/2 (ANOVA, P < 0.05). With the 10 µM P pulse regime, both species often showed a decrease in growth rate right after the pulse (Figure 5-3B; Table 5-II). Another observed phenomenon is the less pronounced fluctuation in cell density in C. abbreviatum compared to S. chaetoceras in the 10 µM P pulse experiment (Figure 5-3B). Particularly in the period of day 2-4, S. chaetoceras displayed a distinctly higher growth rate than C. abbreviatum (Table 5-II, ANOVA, P < 0.05).
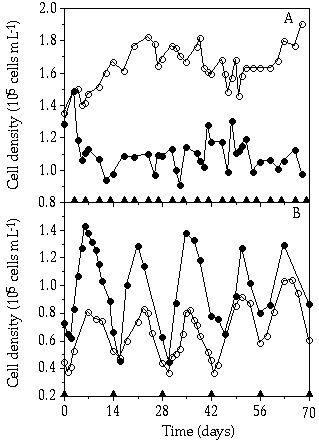
Figure 5-3. Population dynamics of Cosmarium abbreviatum
(![]() ) and Staurastrum chaetoceras
(
) and Staurastrum chaetoceras
(![]() ) during the monoculture experiments
with repeating pulses. P pulses are indicated by triangles on the abscissa:
(A) 2.5 µM P pulse; (B) 10 µM P pulse.
) during the monoculture experiments
with repeating pulses. P pulses are indicated by triangles on the abscissa:
(A) 2.5 µM P pulse; (B) 10 µM P pulse.
Table 5-II. Growth rates on basis of cell numbers (µ, h-1) of C. abbreviatum and S. chaetoceras over different time intervals (d = day number) in the single-species continuous flow cultures (D = 0.007 h-1). Two pulse regimes were used: addition of 2.5 µM P twice a week and 10 µM P once every two weeks. Average ± SD and number of replicates (n) are given.
|
C. abbreviatum |
S. chaetoceras |
|
|
2.5 µM P |
µ (h-1) |
µ (h-1) |
|
d 0 -2 |
0.006 ± 0.003 (25) |
0.004 ± 0.002 (26) |
|
d 2 - 31/2 |
0.008 ± 0.002 (32) |
0.009 ± 0.003 (36) |
|
10 µM P |
|
|
|
d 0 -2 |
0.005 ± 0.003 (14) |
0.004 ± 0.004 (10) |
|
d 2 - 4 |
0.014 ± 0.003 (14) |
0.017 ± 0.004 (11) |
|
d 4 - 7 |
0.011 ± 0.002 (15) |
0.012 ± 0.004 (11) |
|
d 7 - 9 |
0.006 ± 0.002 (14) |
0.005 ± 0.002 (10) |
|
d 9 - 14 |
0.004 ± 0.002 (28) |
0.002 ± 0.004 (20) |
Cell volumes in single-species cultures— Although in both species mean cell volumes fluctuated somewhat during the pulse regime, no significant differences were found between any of the days following the pulse (not shown). However, for both S. chaetoceras and C. abbreviatum, an increase in cell volume measured by the Coulter counter was observed, starting from continuously P-limited conditions with increasing pulse dose (Table 5-III, Kruskal-Wallis, P < 0.001). This was confirmed by measurements under the microscope (see, for C. abbreviatum, Figures 5-4 & 5-5). Microscopic measurements of cell volumes of S. chaetoceras were found to be about equal to those of the Coulter counter (95-115%), whereas cell volumes of C. abbreviatum measured under the microscope were only 70-75% of those given by the Coulter device. As it can reasonably be expected that the size of S. chaetoceras is more readily miscalculated by either method because of the more complicated shape of the cells (six arms on two conical semi-cell bodies) compared to those of C. abbreviatum (two ellipsoid semi-cells), we conclude that the Coulter counter presumably overestimates the average cell volume of C. abbreviatum because it is influenced by its mucous layer. This mucous layer in C. abbreviatum was found to increase with pulse dose as well (Table 5-III and Figures 5-4 & 5-5).
Table 5-III. Average cell volume (µm3 ± SD) of C. abbreviatum and S. chaetoceras, as well as the thickness of the mucous layer in C. abbreviatum (µm ± SD) at different culture conditions. Both Coulter and microscopical measurements are given. Number of Coulter-counted replicates is given in parentheses.
|
|
C. abbreviatum |
S. chaetoceras |
C. abbreviatum |
||||
|
|
Cell volume |
Cell volume |
Mucous layer |
||||
|
|
Microscope |
Coulter |
|
Microscope |
Coulter |
|
Microscope |
|
Continuous P limitation (µ=0.003-0.007 h-1) |
2504 ± 439 |
3386 ± 695 |
(12) |
1828 ±492 |
1725 ± 111 |
(5) |
22 ± 4 |
|
2.5 µM P pulse |
3300 ± 501 |
4237 ± 163 |
(106) |
1903 ± 328 |
2149 ± 127 |
(100) |
29 ± 2 |
|
10 µM P pulse |
3215 ± 537 |
4672 ± 250 |
(92) |
2234 ± 519 |
2572 ± 151 |
(75) |
28 ± 3 |
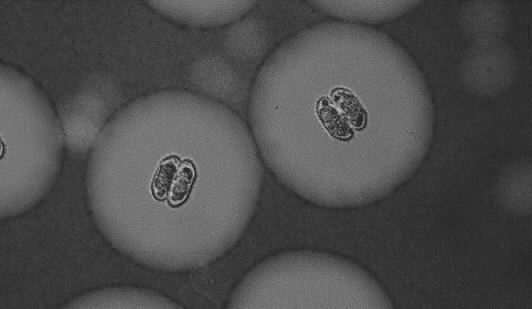
Figure 5-4. Cells of Cosmarium abbreviatum cultured under continuous P-limited conditions (µ = 0.005 h-1). Indian ink highlighting the extracellular mucous envelope.
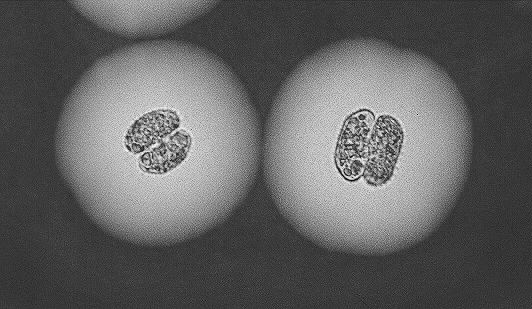
Figure 5-5. Cells of Cosmarium abbreviatum cultured under pulsed P-limited conditions (µ = 0.007 h-1). Indian ink highlighting the extracellular mucous envelope. Notice the increase in cell volume and mucous size compared to the ones shown on Figure 5-4 (same magnification as previous figure).
Competition experiment and replacement rates— Competition for a large pulse (10 µM P) between S. chaetoceras and C. abbreviatum resulted in a dominance for S. chaetoceras, gradually replacing C. abbreviatum during the experiment (Figure 5-6). Like in the single-species experiments, the fluctuations in cell density were larger in S. chaetoceras than C. abbreviatum. When considering the range from continuous P limitation towards a pulsed P limitation with increasing pulse size (and increasing time interval, resulting in a constant total weekly P supply) an optimum for S. chaetoceras can be noticed at intermediate pulse size versus an optimum for C. abbreviatum at a continuous P limitation (Figure 5-7).
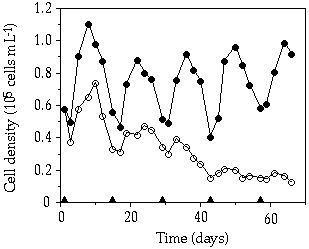
Figure 5-6. Population dynamics of Cosmarium abbreviatum
(![]() ) and Staurastrum chaetoceras(
) and Staurastrum chaetoceras(![]() ) during the competition experiment. P pulses are indicated by triangles on
the abscissa.
) during the competition experiment. P pulses are indicated by triangles on
the abscissa.
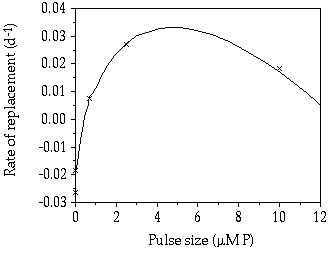
Figure 5-7. Rate of replacement (day-1) of Cosmarium abbreviatum by Staurastrum chaetoceras under different P-limited conditions with equal total weekly P supply.
Regarding the competitive position of phytoplankton species under pulsed P conditions, in particular the following characteristics may be considered relevant: maximum uptake rate, storage capacity, possible lag period in growth, and maximum growth rate on stored P.
For both C. abbreviatum and S. chaetoceras we observed an adaptation in Vi,max and Km comparing uptake kinetics under pulsed P limitation with continuous P limitation (chapter 3). In both species, Vi,max increased in the pulsed P-limited cultures, thus enabling a better utilization of the pulse. The affinity for uptake decreased drastically in C. abbreviatum and increased in S. chaetoceras. This indicates that compared to the uptake kinetics found under continuous P limitation (chapter 3) C. abbreviatum does not invest cellular energy in high affinity for uptake but in maximum uptake rate of large pulses. The higher affinity in S. chaetoceras however, indicates an adaptation towards the uptake of relative small pulses. Vi,max (and Km) in C. abbreviatum before and after the pulse were about the same. A different response was found in S. chaetoceras, where Vi,max remained constant but Km was found to be higher when the pulse had just been consumed. This result indicates a fast adaptive ability of S. chaetoceras to a changing environment. Grover (1991b) found Vi,max to be independent of Qp but measured only 2 days after the pulse. This could have influenced his results because we noticed that a change in Pi uptake characteristics was confined to the period of actual uptake. Quarmby et al. (1982) found that Skeletonema costatum and Chaetoceros gracile growing under pulsed additions of ammonium had both a higher initial uptake rate (Vi,max) and a higher maximum long term uptake rate (Vlt,max) than when ammonium was supplied continuously. They stated that an adaptation in Vi,max would be of advantage in environments where a high frequency of small pulses is common and that an increase in Vlt,max would be advantageous in habitats where nutrient patches are of long duration. We found that under continuously P-limited conditions the Vlt,max in C. abbreviatum was distinctly higher than that in S. chaetoceras thus favouring its occurrence under conditions of infrequent, large pulses (chapter 4).
When pulses of P were given to cells originating from continuously P-limited cultures a time lag in growth was observed. The lag periods of both species described a saturation curve with pulse dose (chapter 4): the cells took up P until either the pulse was exhausted or the internal maximum cell quota (Q'max) was reached. It was found that C. abbreviatum and S. chaetoceras were significantly different in Q'max (chapter 4). The lag periods after pulsing in the single-species experiments described in the present paper lasted longer than those described for these species originating from continuously P-limited cultures provided with the same pulse dose (chapter 4). It was not possible to relate the decrease in cell density observed in the period directly after the pulse to the time needed to take up P at Vi,max or Vlt,max. From these observations we conclude that P uptake and internal P quota are not the only factors that determine the length of the lag period; probably the history of the cells is also involved. When cells from starved conditions are subjected to a pulse, the lag will possibly last longer than in cells originating from continuously P-limited conditions. Starved cells might require more time for changing cell metabolism from uptake to growth as the starvation has been of longer duration. Time lags in our experiment were of the same order as found by Grover (1991b) for Chlorella and Scenedesmus in similar experiments. Like in his experiments the lag periods can only be roughly estimated and are therefore hard to relate to concrete physiological characteristics. To acquire more detailed knowledge about the outcome of competition of phytoplankton species under pulsed P limitation, it is necessary to study the characteristics of the lag period more precisely in relation to algal physiology.
The observed difference in maximum cellular P quota (Q'max, being 3 times higher in C. abbreviatum than in S. chaetoceras, chapter 4) will result in an advantage for C. abbreviatum compared to S. chaetoceras with increasing pulse size and time interval between the pulses. Although in none of our pulsed P competition experiments Q'max was reached in either species, the above-predicted phenomenon is roughly shown in Figure 5-7.
The data presented in Figure 5-7 are in agreement with the intermediate disturbance hypothesis of Connell (1978). This theory was demonstrated in practice by Robinson & Sandgren (1983), Gaedeke & Sommer (1986) and Sommer (1995) who showed that species richness in their experiments was the highest at an intermediate pulse regime of different nutrients. Applying this intermediate disturbance hypothesis to our results and to the growth strategies as distinguished by Crowley (1975) it can be hypothesized that in the range from continuous nutrient limitation to very frequent, very small pulses there will be a strong selection in a phytoplankton population favouring affinity adapted species (high Vi,max/Km). With increasing pulse interval and larger pulse dose, the velocity-adapted species (high Vi,max and high µmax) will benefit and become dominant, but the fluctuations in different nutrient concentrations offer possibilities for many species to co-exist. However, when pulses become still more pronounced and less frequent, according to our results, selection for the ability to store a limiting nutrient after the pulse (high Q'max/Q0, Q0 being the minimum cellular P quota, and low µmax) will possibly become more important, imposing a lower species diversity. From our results with the two desmid species under discussion we have to conclude that C. abbreviatum is the better storage and affinity specialist compared to S. chaetoceras that has more of the characteristics of a velocity specialist. Two different combinations of P pulse and interval size can then be suggested under which the two species possibly co-exist. The first combination i.e. of small, frequent pulses, was discussed theoretically by Stewart & Levin (1973) and demonstrated to be valid for the two desmid species (chapter 3). From Figure 5-7 co-existence under a second combination i.e. of big, little frequent pulses, can be derived. Indeed, Hsu (1980) showed theoretically that co-existence of two competitors might also occur at big pulses at low frequency. However, until now no experimental study on the co-existence of two species under such a pulse regime has been performed.
For both desmid species a significant adaptation in cell size to the P supply regimes examined could be measured with both Coulter counter and microscope. Both C. abbreviatum and S. chaetoceras increase their cell volume in response to a larger P addition. Possibly the vacuole increases and, with that, storage ability (Stolte & Riegman 1995). This finding suggests that cellular storage ability increases with increasing pulse dose (indications of enlarged storage ability under pulsed P limitation were found in our experiments, results not shown). It was found by Suttle et al. (1987, Figure 6) that not only the average cell volume in a phytoplankton sample but also the average cell length of Synedra radians, increased with increasing pulse dose. Next to an increase in cell volume of C. abbreviatum a bigger mucous layer around the Cosmarium cells was detected under pulsed P conditions. With increasing P limitation the production of extracellular polysaccharides is enhanced (Strycek et al. 1992, Domozych et al. 1993). With respect to C. abbreviatum, the thickness of the mucous layer was found to decrease at low light intensities (Coesel & Wardenaar 1994). We observed that the mucilage layer was somewhat thicker under stringent P limitation compared to its size under light-limited conditions (15-22 µm), but dimensions increased still more when exposed to pulsed P-limited conditions disregarding the size of the pulse. It is possible that the enlargement of the extracellular mucous envelope is another way for C. abbreviatum to increase its surface area and, with that, its uptake possibilities for a limiting nutrient after a pulsed addition.
Sommer (1984, 1985) showed in competition experiments that species grown under a pulsed nutrient limitation can react by oscillating as well as by stable cell densities. In our experiments both S. chaetoceras as C. abbreviatum oscillated in the pulsed mono-cultures, showing larger fluctuations with larger pulse dose (comparable to Grover 1991b). Fluctuations in S. chaetoceras were larger than those in C. abbreviatum and this was best visualized in the competition experiments where cell densities in S. chaetoceras were found to oscillate more pronouncedly than in C. abbreviatum. Sommer (1984) defined a velocity-adapted species as one showing oscillating densities under pulsed conditions, whereas a storage- or affinity-adapted species would show more stable population densities. Applying this characterization to our data concerning the two desmid species, it is concluded that S. chaetoceras tends to a velocity specialist and C. abbreviatum to an affinity/storage specialist. This conclusion could already be drawn after measurements on continuous P-limited cultures (chapters 2 & 3) but is strongly supported by the kinetic data from pulsed P conditions provided here.